Close Menu
    What's Hot

    Here’s why Sonic erased $1.3 billion in value

    Whales lose SYRUP sweet tooth despite Maple Finance’s growth

    Ethereum Prepares For A Parabolic Move – ETH/BTC Chart Signals Strong Bullish Setup

    Facebook X (Twitter) Instagram
    yeek.io
    • Crypto Chart
    • Crypto Price Chart
    X (Twitter) Instagram TikTok
    Trending Topics:
    • Altcoin
    • Bitcoin
    • Blockchain
    • Crypto News
    • DeFi
    • Ethereum
    • Meme Coins
    • NFTs
    • Web 3
    yeek.io
    • Altcoin
    • Bitcoin
    • Blockchain
    • Crypto News
    • DeFi
    • Ethereum
    • Meme Coins
    • NFTs
    • Web 3
    Altcoin

    Bittensor [TAO] could fall to $216 – But a relief rally may come next

    Yeek.ioBy Yeek.ioMarch 10, 2025No Comments3 Mins Read
    Share Facebook Twitter Pinterest Copy Link Telegram LinkedIn Tumblr Email
    Share
    Facebook Twitter LinkedIn Pinterest Email
    • Bittensor indicators showed firm bearishness.
    • A short-term price bounce was possible, but watch out for Monday’s volatility.

    Bittensor [TAO] posted large losses in recent weeks as another wave of bearish sentiment swept across the crypto market. The $434 level was ceded as a support level in early 2025.

    The $500 psychological level has been tested multiple times but saw swift rejections.

    The most recent one happened on the 21st of February. Since then, TAO has shed 46% in value. The $216 support level from July 2024 was swiftly looming, and the bulls appeared powerless to stop more losses.

    Yet, the liquidation heatmap hinted otherwise.

    Is TAO readying for a 15% price bounce?

    TAO 1-day Chart

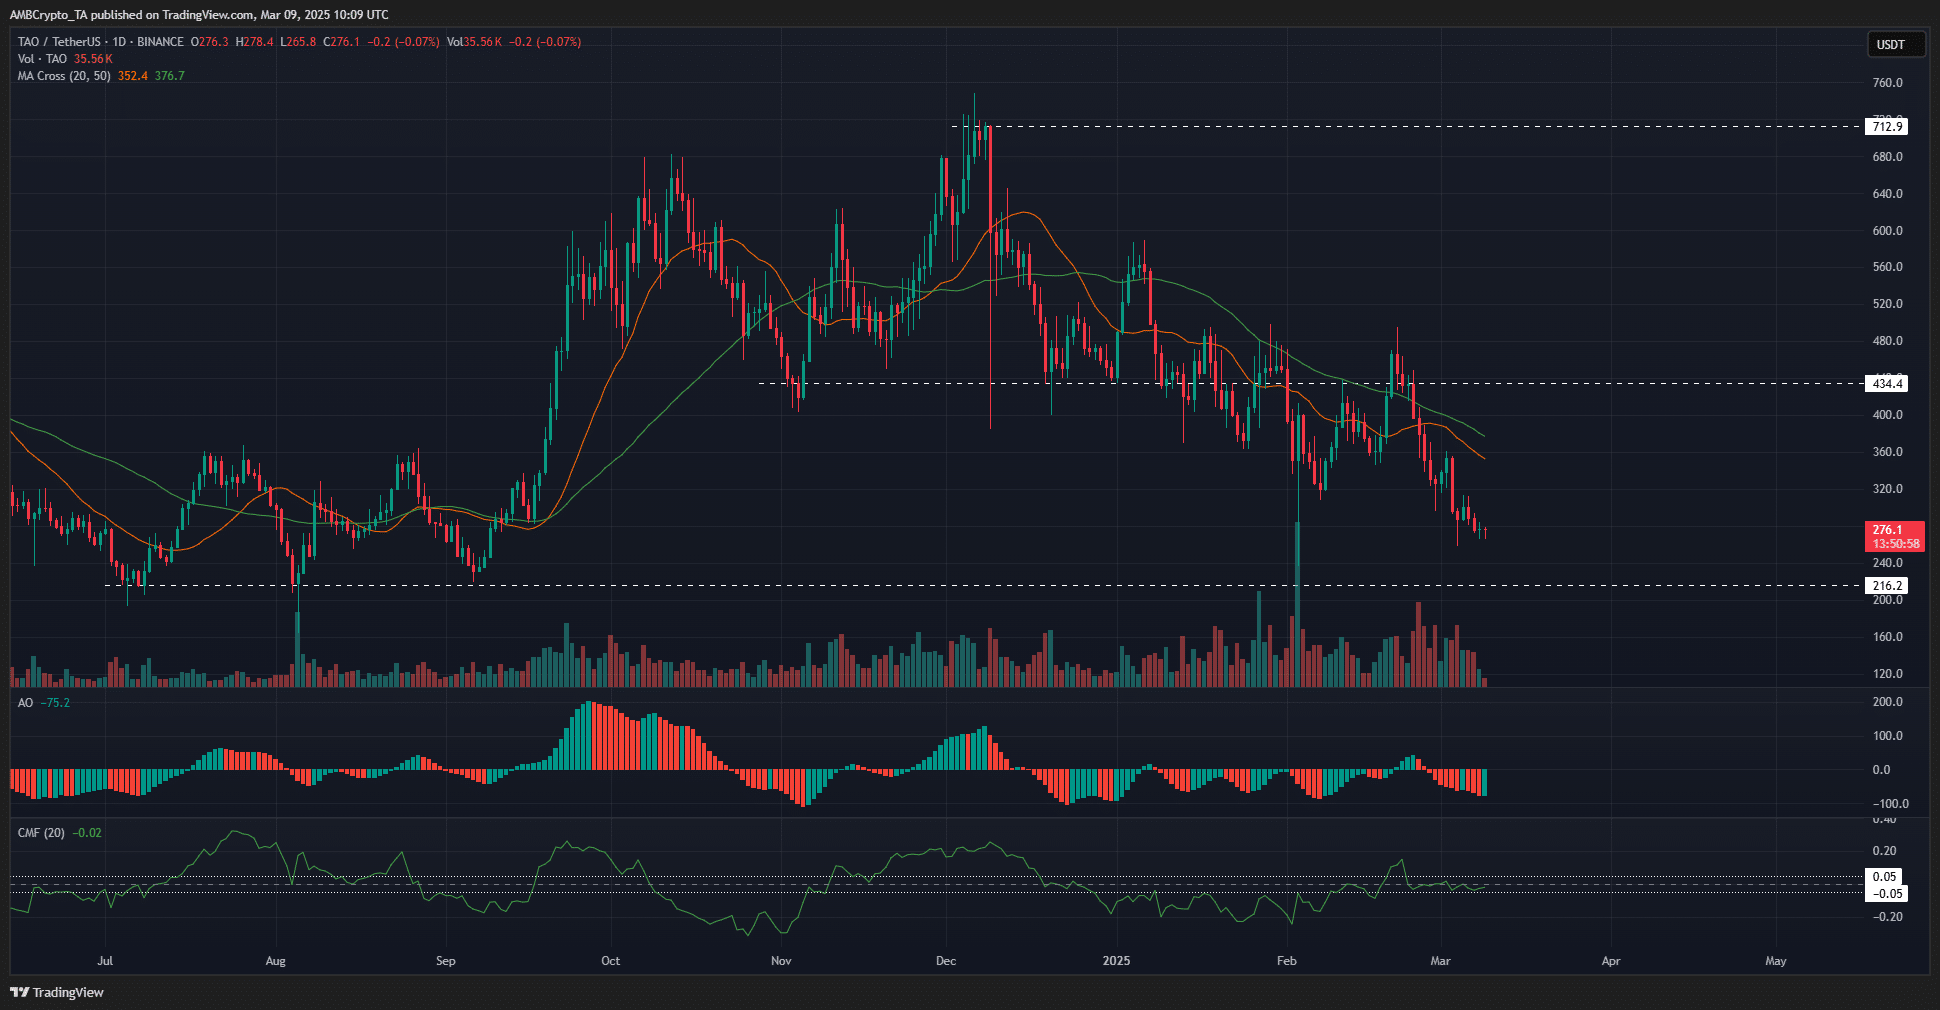
    Source: TAO/USDT on TradingView

    From a technical analysis viewpoint, TAO remained in a strong bearish trend. It has made only lower lows in 2025 and no new higher highs, and the daily market structure was firmly in favor of the sellers.

    The Awesome Oscillator continued to show bearish dominance, as it has for most of the year. The CMF has failed to climb above +0.05 except on one occasion in the second half of February.

    Even then, the volume indicator quickly retraced.

    The moving averages reinforced the idea of dominant bearish momentum. The $320 and the lower high at $360.5 were the two key resistances nearby.
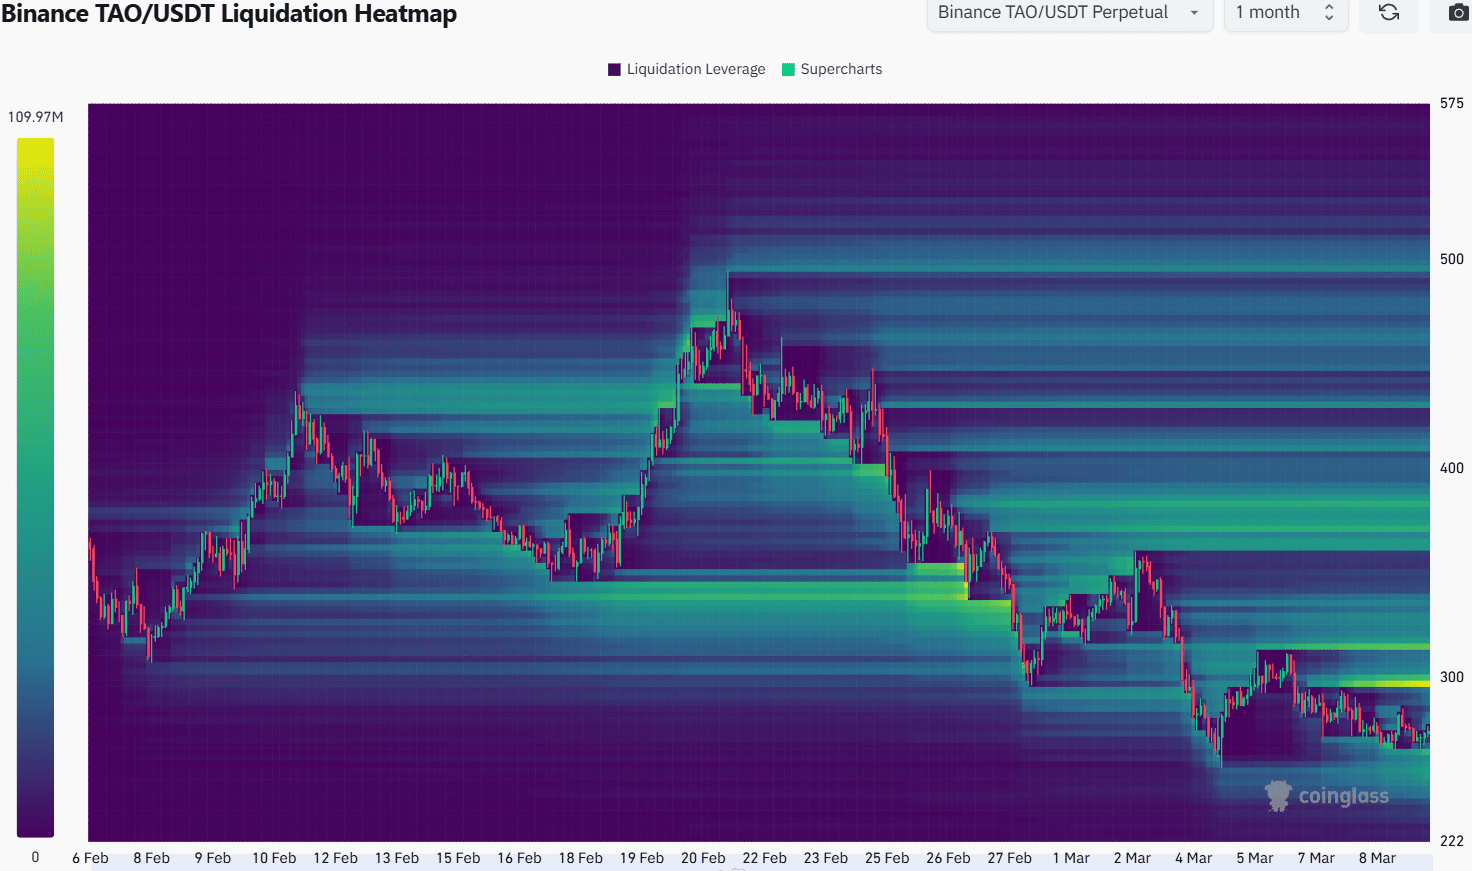
    Bittensor Liquidation HeatmapBittensor Liquidation Heatmap

    Source: Coinglass

    The 1-month liquidation heatmap showed that the closest pockets of liquidity to the north were $296 and $314. Hence, the bulls could have a hard time driving prices further higher, in the event of a bounce.

    The chance of a bounce was good, but the liquidity around $250 might need to be swept.
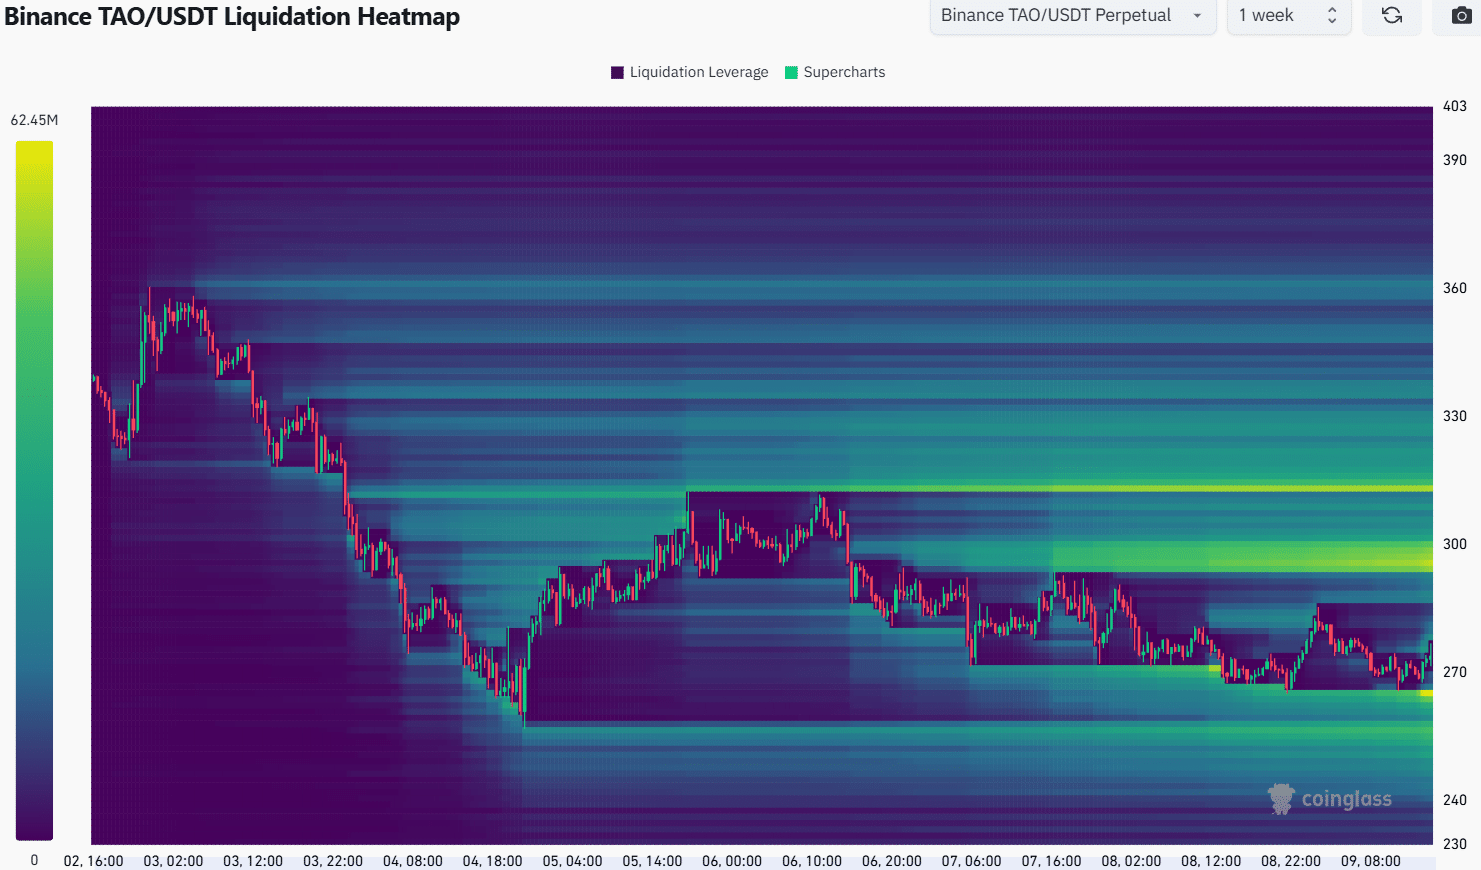
    Bittensor Liquidation HeatmapBittensor Liquidation Heatmap

    Source: Coinglass

    The 1-week chart showed $250-$260 as a magnetic zone. It could be tested in the coming hours.

    Depending on the Bitcoin [BTC] performance, Bittensor might fall well below $250, or it might decide to reverse the downward trajectory.

    Since the liquidity around $300 was sizeable, it was likely that a price bounce was brewing. Hence, traders can look for opportunities to go long after a retest of $250-$260.

    Instead of jumping in, signs of reversal on the lower timeframes can be used to gauge if it is a buying opportunity.

    An uptick in volume and OI after defending this key support, or a Doji candlestick, could help traders. This was because continued BTC losses could easily take TAO prices to $216.

    Disclaimer: The information presented does not constitute financial, investment, trading, or other types of advice and is solely the writer’s opinion

    Next: Bitcoin whale holdings drop to 6-year low: What it means for BTC

    Follow on Google News Follow on Flipboard
    Share. Facebook Twitter Pinterest LinkedIn Tumblr Email Copy Link
    Previous ArticleUtah’s Senate passes Bitcoin bill — but scraps key provision
    Next Article Bitcoin reserve backlash signals unrealistic industry expectations
    Avatar
    Yeek.io
    • Website

    Yeek.io is your trusted source for the latest cryptocurrency news, market updates, and blockchain insights. Stay informed with real-time updates, expert analysis, and comprehensive guides to navigate the dynamic world of crypto.

    Related Posts

    Why is crypto up today—FOMC news, ETF flows and…

    March 20, 2025

    Binance Coin (BNB) Price Prediction for March 20

    March 20, 2025

    Trump becomes first US sitting president to speak at a crypto conference

    March 20, 2025
    Leave A Reply Cancel Reply

    Advertisement
    Demo
    Latest Posts

    Here’s why Sonic erased $1.3 billion in value

    Whales lose SYRUP sweet tooth despite Maple Finance’s growth

    Ethereum Prepares For A Parabolic Move – ETH/BTC Chart Signals Strong Bullish Setup

    Ethereum Enters Strategic Pause: Will Accumulation Below Resistance Spark A Surge?

    Popular Posts
    Advertisement
    Demo
    X (Twitter) TikTok Instagram

    Categories

    • Altcoin
    • Bitcoin
    • Blockchain
    • Crypto News

    Categories

    • Defi
    • Ethereum
    • Meme Coins
    • Nfts

    Quick Links

    • Home
    • About
    • Contact
    • Privacy Policy

    Important Links

    • Crypto Chart
    • Crypto Price Chart
    © 2025 Yeek. All Copyright Reserved

    Type above and press Enter to search. Press Esc to cancel.