
- BONK’s breakout from the descending trendline hinted at a potential bullish reversal
- Positive market indicators and rising Open Interest pointed to sustained upward momentum on the charts
Bonk [BONK] recently flashed a buy signal on the TD Sequential indicator, signaling the potential for a price reversal. This technical signal is known to point to a shift in market sentiment, one often following a prolonged downtrend. What it implies is that market momentum could turn bullish, setting the stage for upward price movement on the charts.
At the time of writing, BONK was trading at $0.00001234, following a hike of 5.06% over the last 24 hours.
Hence, the question is this – Will the TD Sequential signal trigger a sustained rally or will resistance levels prevent further gains?
What does memecoin’s technical analysis say about the trend reversal?
BONK’s latest breakout from a descending trendline has marked a pivotal moment for the memecoin. This technical development hinted that BONK could be ready for a bounce. In fact, the press time support level was positioned at $0.00000954, while resistance sat at $0.00001235.
These levels are crucial for determining whether the price can continue north or face further resistance. Additionally, the RSI’s position at 48.46 implied that BONK was neither overbought nor oversold, at press time.
To put it simply, the memecoin still has ample room for price movement. The MACD histogram turned green too, alluding to a shift towards bullish momentum, reinforcing the case for a potential uptrend.
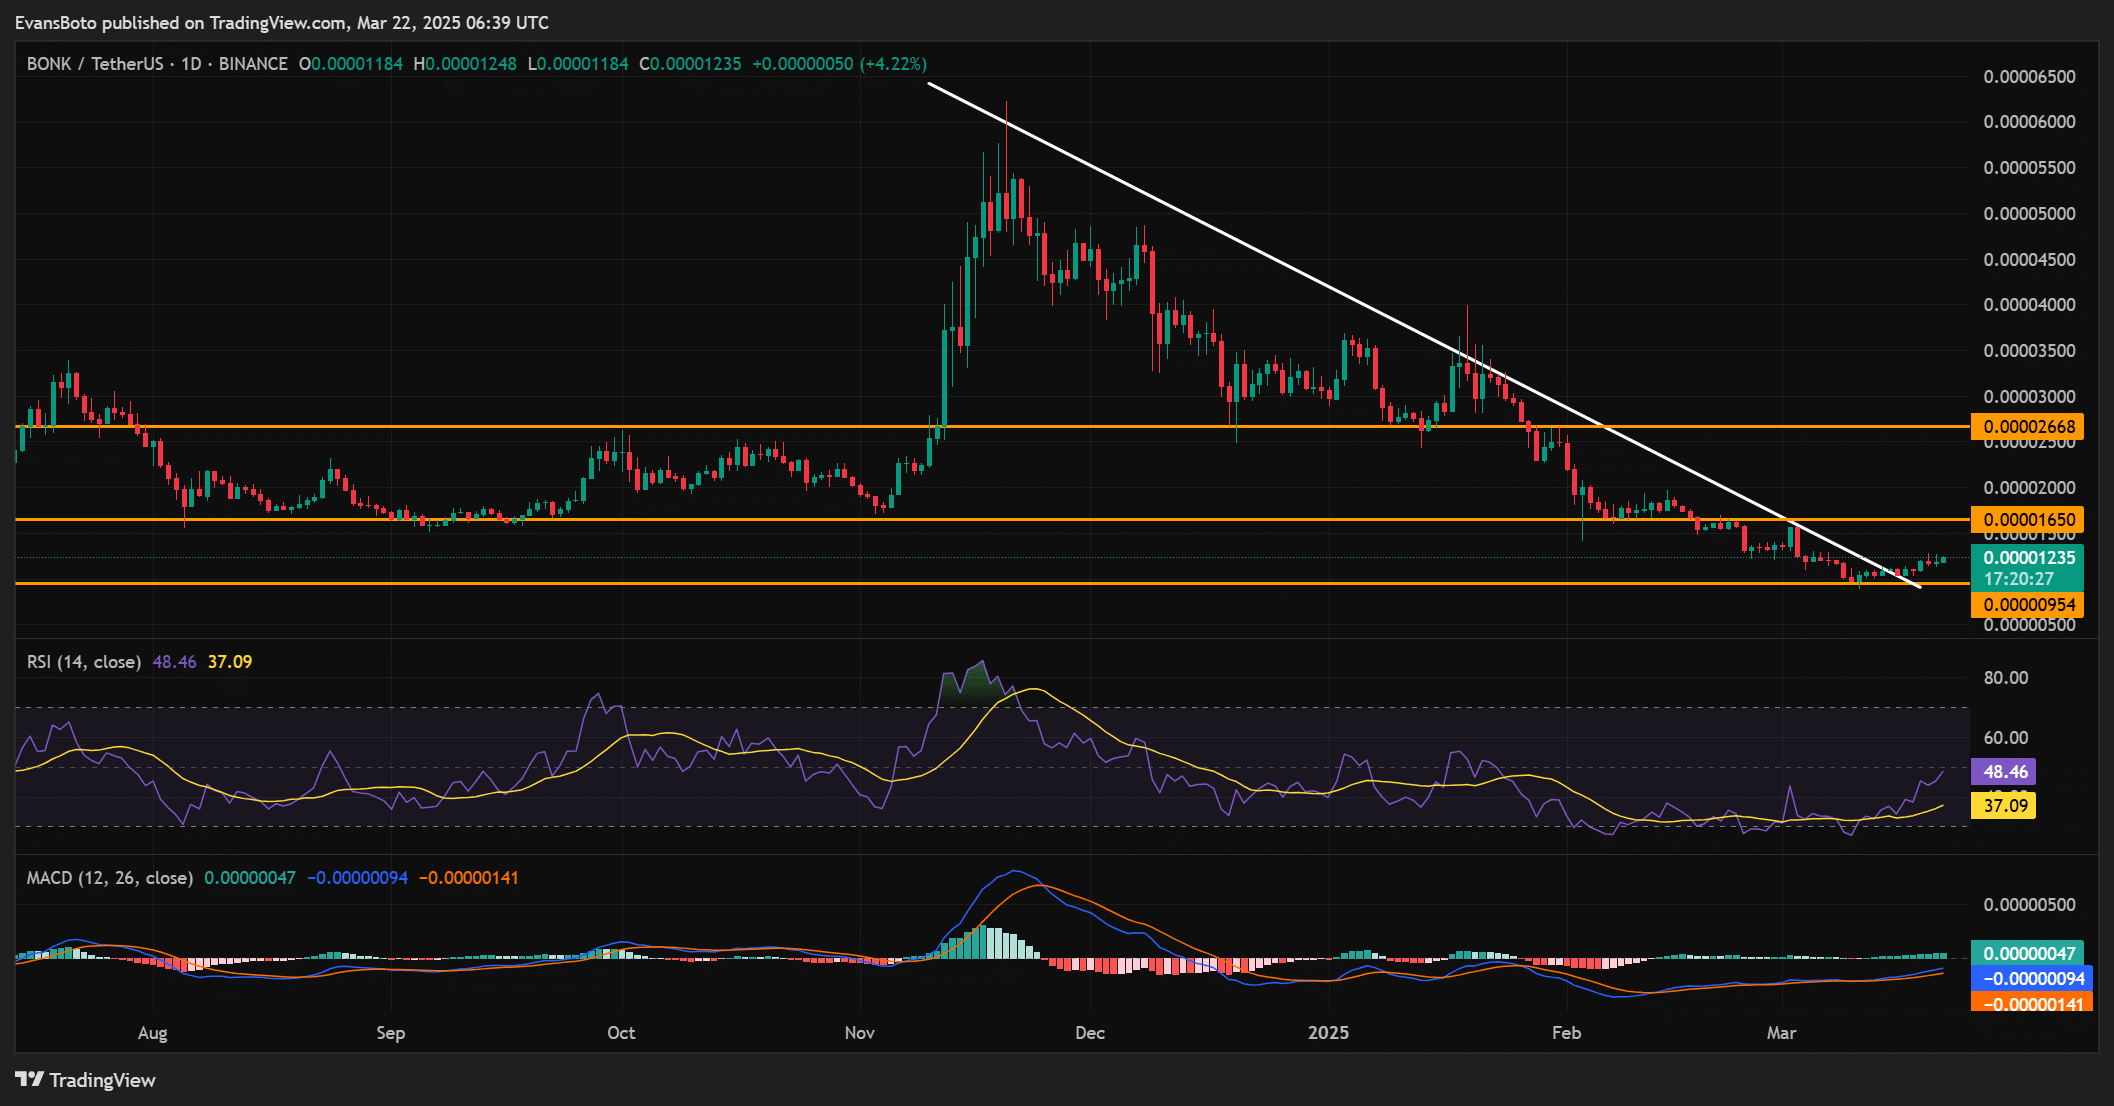
Source: TradingView
How does the liquidation heatmap reflect the current market sentiment?
The liquidation heatmap for BONK revealed significant trading activity around the $0.00001200-mark. This zone is particularly critical because it underlines high liquidation points. If the price continues to rise and hits this resistance, short positions can be squeezed, contributing further to the upward price pressure.
Additionally, the concentration of liquidity at this level highlighted that traders are actively positioning themselves for possible price movement. This type of market behavior often adds to the volatility, which could favor bulls in the short term.
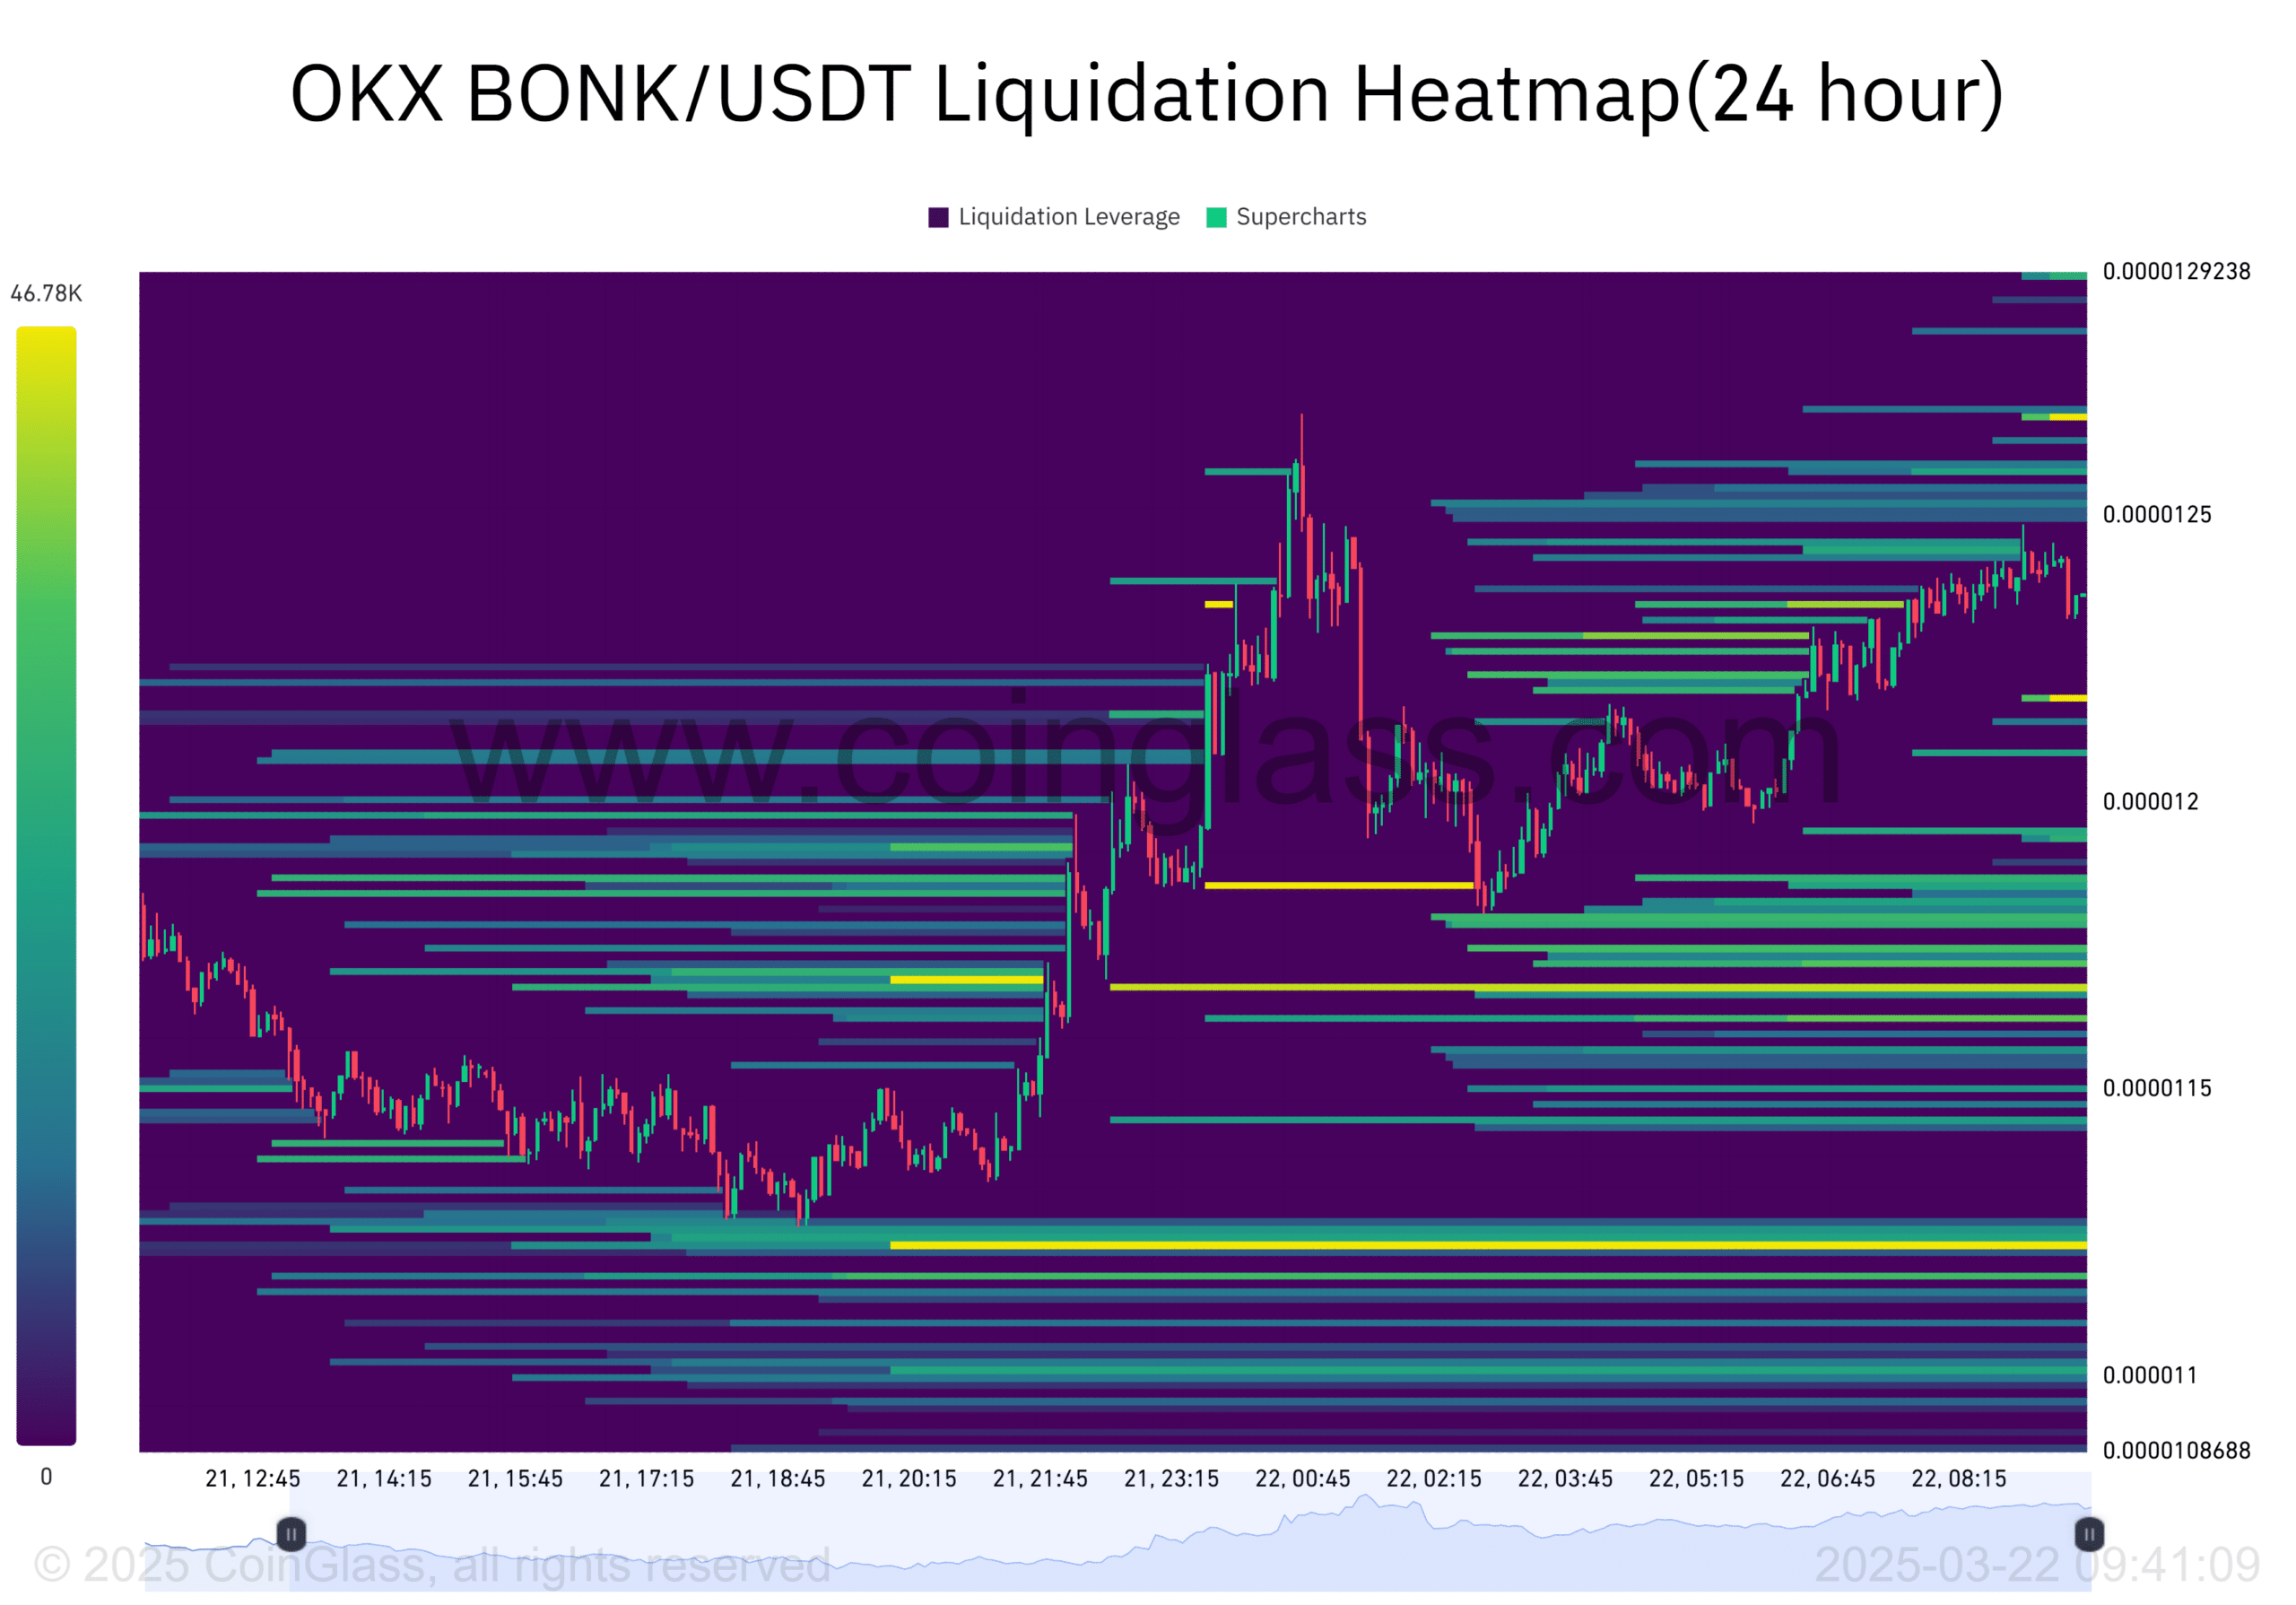
Source: Coinglass
An assessment of Open Interest
BONK’s Open Interest rose by 12.20%, with the same totaling $12.79 million at the time of writing. This surge hinted at greater market participation, suggesting that more traders are betting on the cryptocurrency’s future price direction.
Higher Open Interest typically signals growing confidence in the asset, which supports the possibility of sustained bullish movement. However, it also introduces the potential for greater volatility. Hence, traders should remain cautious of sharp price fluctuations.
Additionally, the OI-weighted funding rate for BONK had a value of -0.0017%, indicating that short positions may be slightly favored.
While this is not a major concern, it pointed to a slight imbalance in the market. And yet, the overall sentiment appeared to be bullish, supported by positive technical indicators and rising Open Interest.
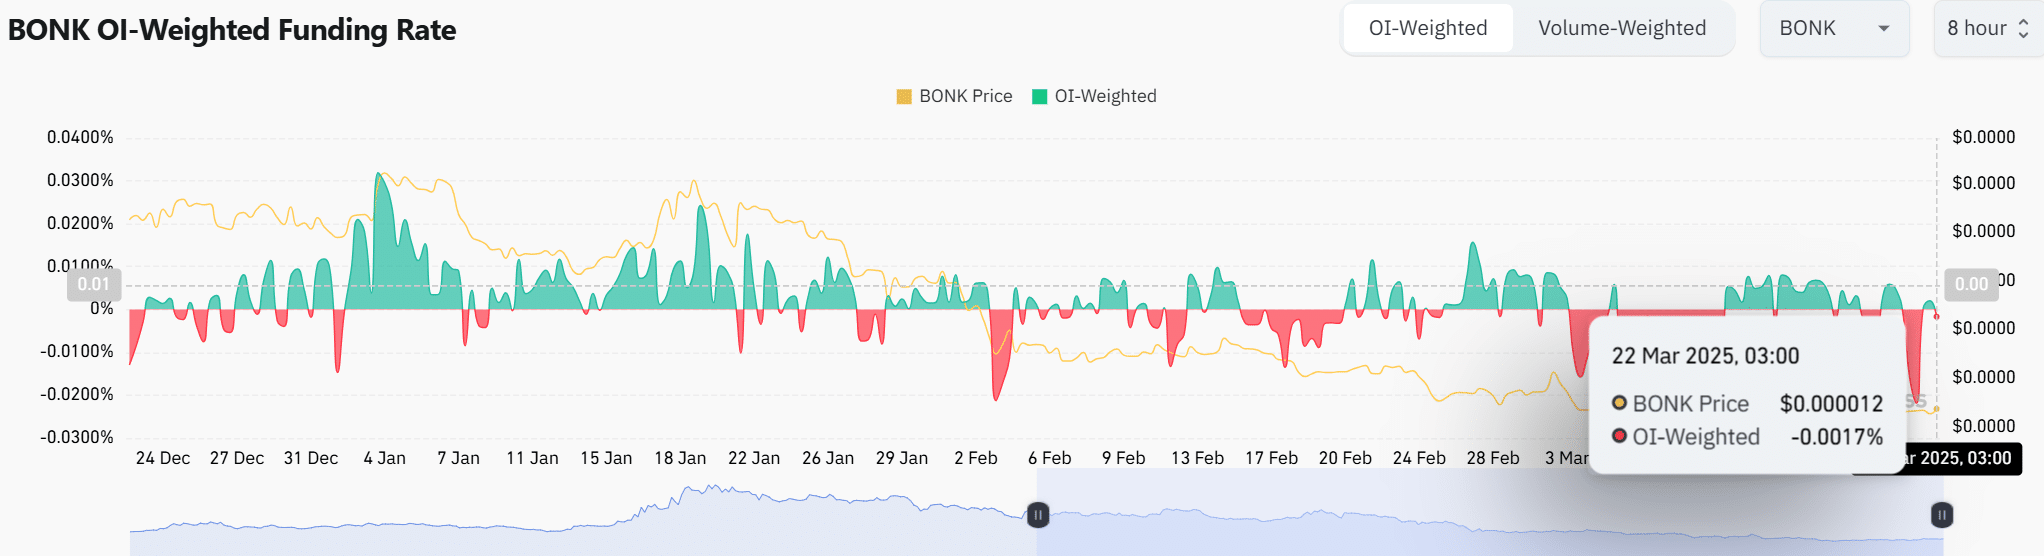
Source: Coinglass
Conclusion
What is clear right now is that BONK has been showing clear signs of a trend reversal. The breakout from the descending trendline, coupled with the TD Sequential buy signal, suggested that a longer-term rally could be underway.
However, resistance levels and short positions will continue to play a crucial role in determining the sustainability of this move.