Close Menu
    What's Hot

    Ethereum Enters Strategic Pause: Will Accumulation Below Resistance Spark A Surge?

    Solana indicators point north, bulls test $165 target

    Cardano is at the Nexus of Bitcoin DeFi: Charles Hoskinson

    Facebook X (Twitter) Instagram
    yeek.io
    • Crypto Chart
    • Crypto Price Chart
    X (Twitter) Instagram TikTok
    Trending Topics:
    • Altcoin
    • Bitcoin
    • Blockchain
    • Crypto News
    • DeFi
    • Ethereum
    • Meme Coins
    • NFTs
    • Web 3
    yeek.io
    • Altcoin
    • Bitcoin
    • Blockchain
    • Crypto News
    • DeFi
    • Ethereum
    • Meme Coins
    • NFTs
    • Web 3
    Meme Coins

    BONK stalls at local resistance – Should you buy the dip or wait?

    Yeek.ioBy Yeek.ioMay 26, 2025No Comments2 Mins Read
    Share Facebook Twitter Pinterest Copy Link Telegram LinkedIn Tumblr Email
    Share
    Facebook Twitter LinkedIn Pinterest Email


    • The trendline support has been important in May.
    • A short-term range formation could aid buyers looking to re-enter the BONK market.

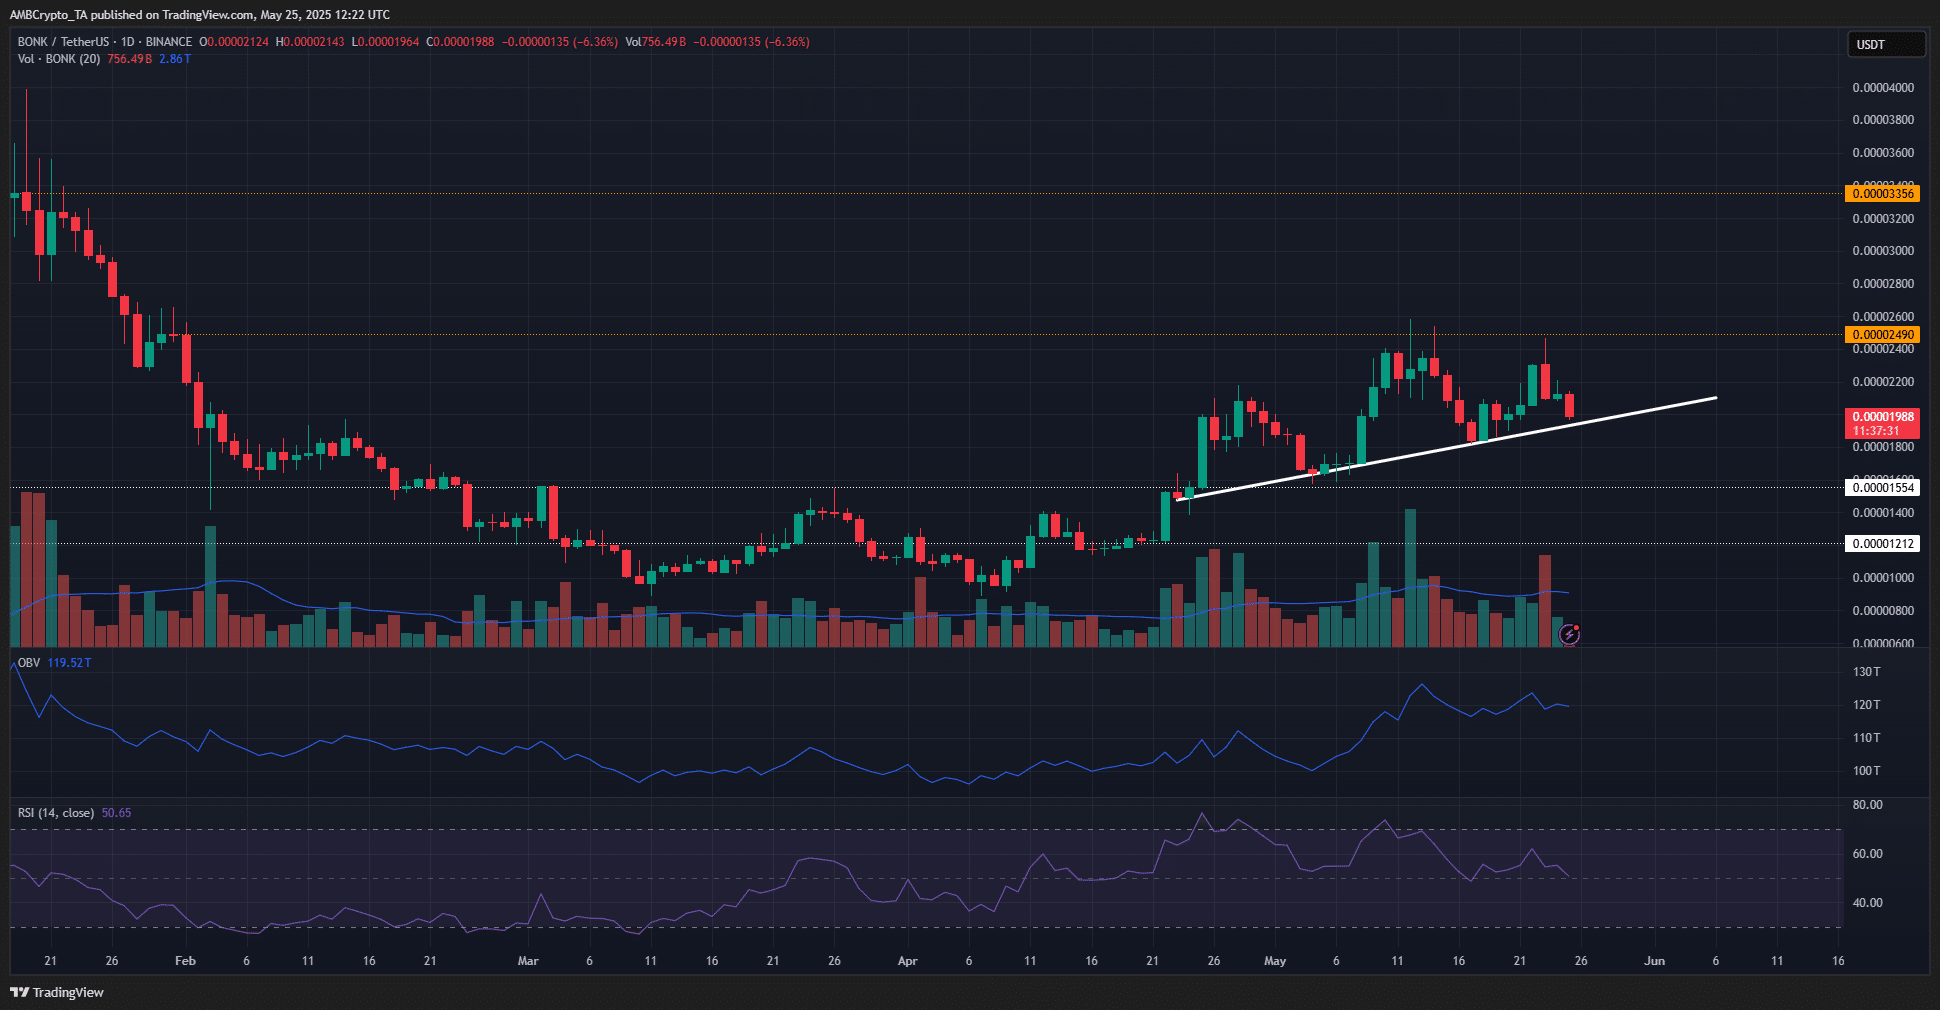
    Bonk [BONK] saw a rejection at the $0.0000249 resistance level, the same level that rebuffed its bulls on the 14th of May. On the 1-day chart, BONK had a bullish structure. For close to a month, BONK has defended a rising trendline support.

    However, it failed to break above the $0.0000249 resistance, which previously formed a lower high during the late-January downtrend

    BONK 1-day Chart

    Source: BONK/USDT on TradingView

    The Trading Volume has been relatively high over the past three weeks. This saw the OBV trend higher in May, after a rocky start to the month.

    The new highs the OBV set reflected increased buying pressure on the token.

    Over the past week, the RSI of BONK has corrected from strong bullish momentum to neutral/weakly bullish momentum, based on how close it has been to the neutral 50 level.

    Taken together, the price action and indicators suggested that more bullishness was warranted. A retest of the trendline support could offer a buying opportunity.

    Where should BONK traders scoop up the dip?

    BONK 4-hour ChartBONK 4-hour Chart

    Source: BONK/USDT on TradingView

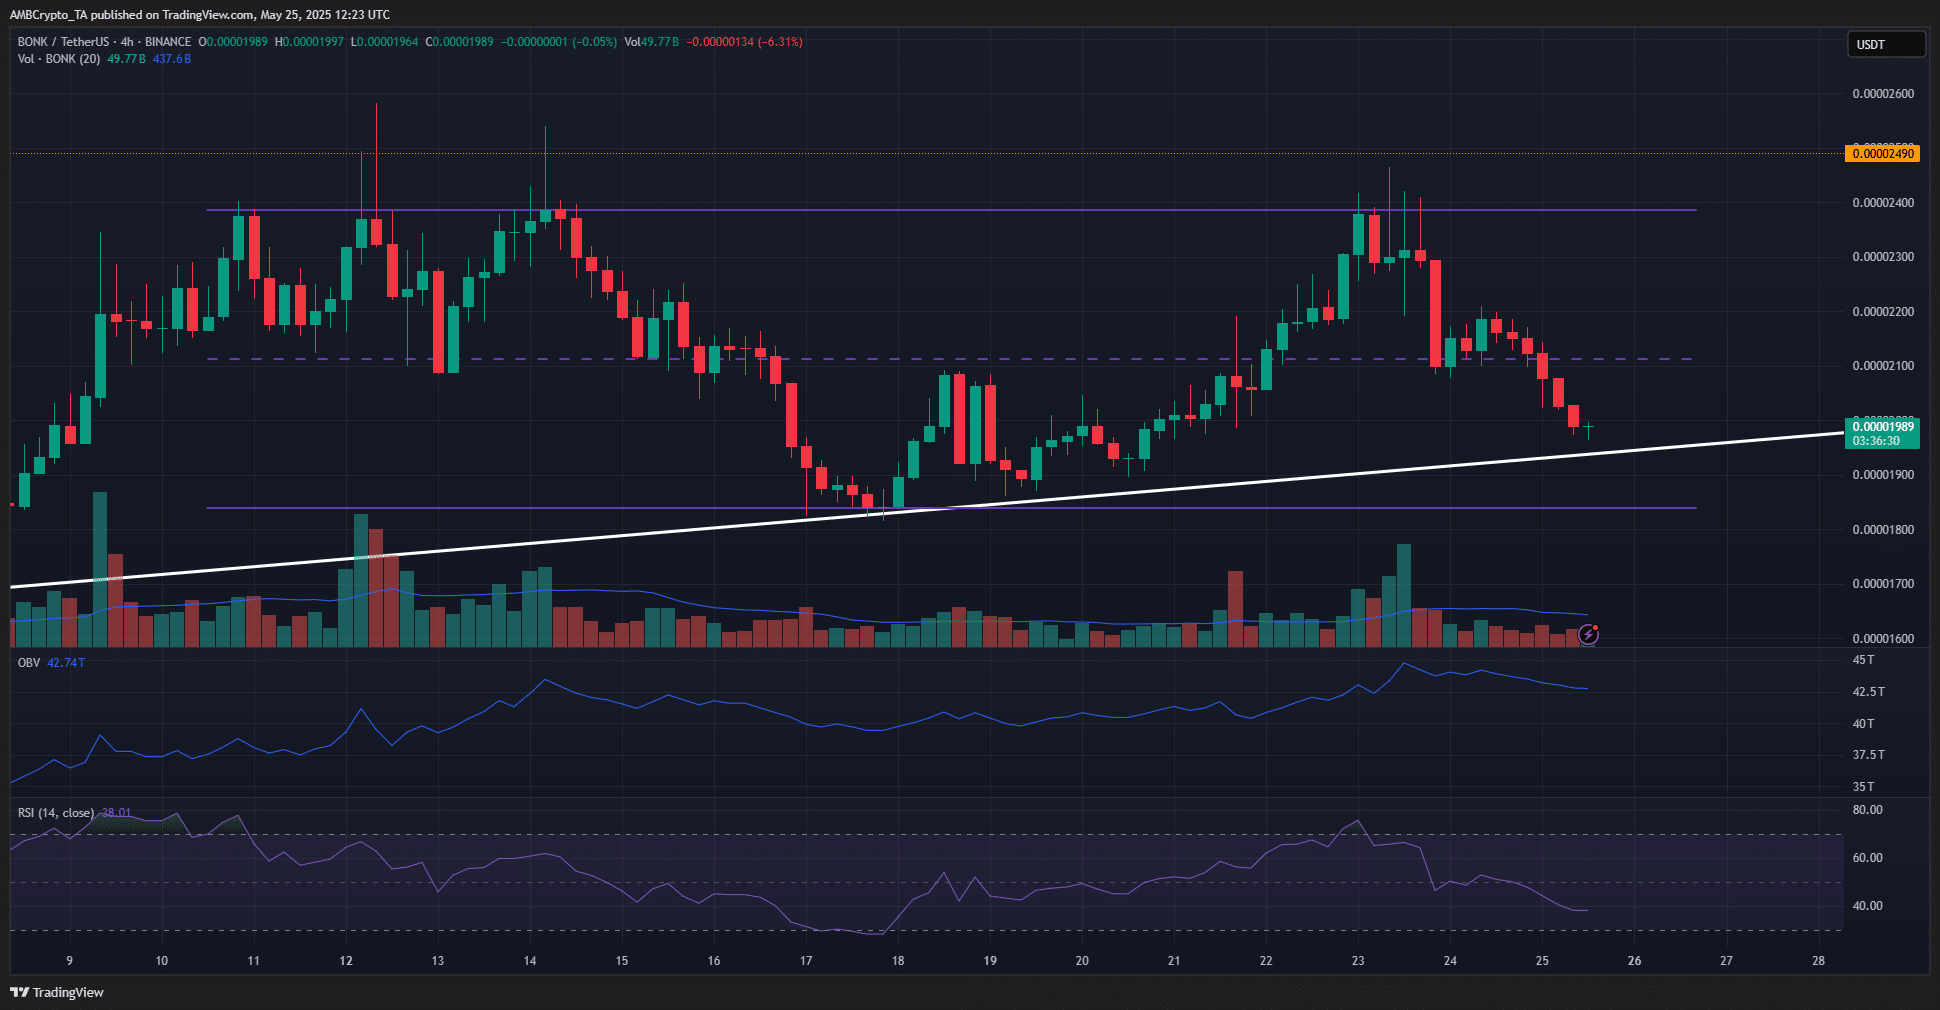
    The 4-hour chart showed a range formation over the past ten days. This range (purple) extended from $0.000018 to $0.000024. The mid-range level was at $0.000021, and it served as support a few days ago.

    The RSI on the 4-hour chart showed bearish momentum. The OBV did not fall too deep, and the trading volume has been below average during the memecoin’s price dip. This suggests that the buyers will regain strength and push higher in the coming days.

    The selling pressure in the past two days came alongside the Bitcoin [BTC] reset from the $111k mark. It bumped BONK beneath the $0.000021 support, and headed toward the trendline resistance or the local low (the range low) at $0.000018.

    Hence, a retest of these levels should offer a buying opportunity.

    Disclaimer: The information presented does not constitute financial, investment, trading, or other types of advice and is solely the writer’s opinion

    Next: Decoding Base’s upgrade plan: Is it ready to take on Ethereum?

    Follow on Google News Follow on Flipboard
    Share. Facebook Twitter Pinterest LinkedIn Tumblr Email Copy Link
    Previous ArticleEthereum selling pressure may rise near $2.8K level: Analysis
    Next Article Swedish health tech firm H100 secures $2.2m via convertible loans to buy Bitcoin
    Avatar
    Yeek.io
    • Website

    Yeek.io is your trusted source for the latest cryptocurrency news, market updates, and blockchain insights. Stay informed with real-time updates, expert analysis, and comprehensive guides to navigate the dynamic world of crypto.

    Related Posts

    Dogecoin faces a sell wall – Will smart money hold or fold at $0.17?

    June 7, 2025

    Analyzing Dogecoin’s price recovery odds in the wake of Trump-Musk spat

    June 7, 2025

    Examining PENGU’s 9% pump – Will spot sell pressure ruin the bullish setup?

    June 7, 2025
    Leave A Reply Cancel Reply

    Advertisement
    Demo
    Latest Posts

    Ethereum Enters Strategic Pause: Will Accumulation Below Resistance Spark A Surge?

    Solana indicators point north, bulls test $165 target

    Cardano is at the Nexus of Bitcoin DeFi: Charles Hoskinson

    ChatGPT vs Cursor.ai vs Windsurf

    Popular Posts
    Advertisement
    Demo
    X (Twitter) TikTok Instagram

    Categories

    • Altcoin
    • Bitcoin
    • Blockchain
    • Crypto News

    Categories

    • Defi
    • Ethereum
    • Meme Coins
    • Nfts

    Quick Links

    • Home
    • About
    • Contact
    • Privacy Policy

    Important Links

    • Crypto Chart
    • Crypto Price Chart
    © 2025 Yeek. All Copyright Reserved

    Type above and press Enter to search. Press Esc to cancel.