Close Menu
    What's Hot

    Ethereum Prepares For A Parabolic Move – ETH/BTC Chart Signals Strong Bullish Setup

    Ethereum Enters Strategic Pause: Will Accumulation Below Resistance Spark A Surge?

    Solana indicators point north, bulls test $165 target

    Facebook X (Twitter) Instagram
    yeek.io
    • Crypto Chart
    • Crypto Price Chart
    X (Twitter) Instagram TikTok
    Trending Topics:
    • Altcoin
    • Bitcoin
    • Blockchain
    • Crypto News
    • DeFi
    • Ethereum
    • Meme Coins
    • NFTs
    • Web 3
    yeek.io
    • Altcoin
    • Bitcoin
    • Blockchain
    • Crypto News
    • DeFi
    • Ethereum
    • Meme Coins
    • NFTs
    • Web 3
    Meme Coins

    BONK surges 10% – Will the memecoin finally crack $0.00002?

    Yeek.ioBy Yeek.ioMay 9, 2025No Comments2 Mins Read
    Share Facebook Twitter Pinterest Copy Link Telegram LinkedIn Tumblr Email
    Share
    Facebook Twitter LinkedIn Pinterest Email
    • BONK surged nearly 10% after rebounding from wedge support, hinting at growing bullish momentum.
    • On-chain and technical metrics lean bullish, setting the stage for a potential breakout above resistance.

    Bonk [BONK] has been respecting a rising wedge pattern since the 4th of March, with the memecoin’s prices respecting the ascending support trendline.

    In early April, the memecoin hit a local low of $0.00000884 before rebounding and maintaining a steady upward pace.

    BONK has, since then, enjoyed a steady bullish surge while obeying the wedge’s trendline support level.

    The recent bounce off the support level has initiated a fresh wave of optimism among holders.

    According to CoinMarketCap data, the memecoin surged by nearly 10% following the move, suggesting a building of bullish momentum.

    This surge comes as prices are still compressing within the wedge, usually a sign of an imminent breakout.
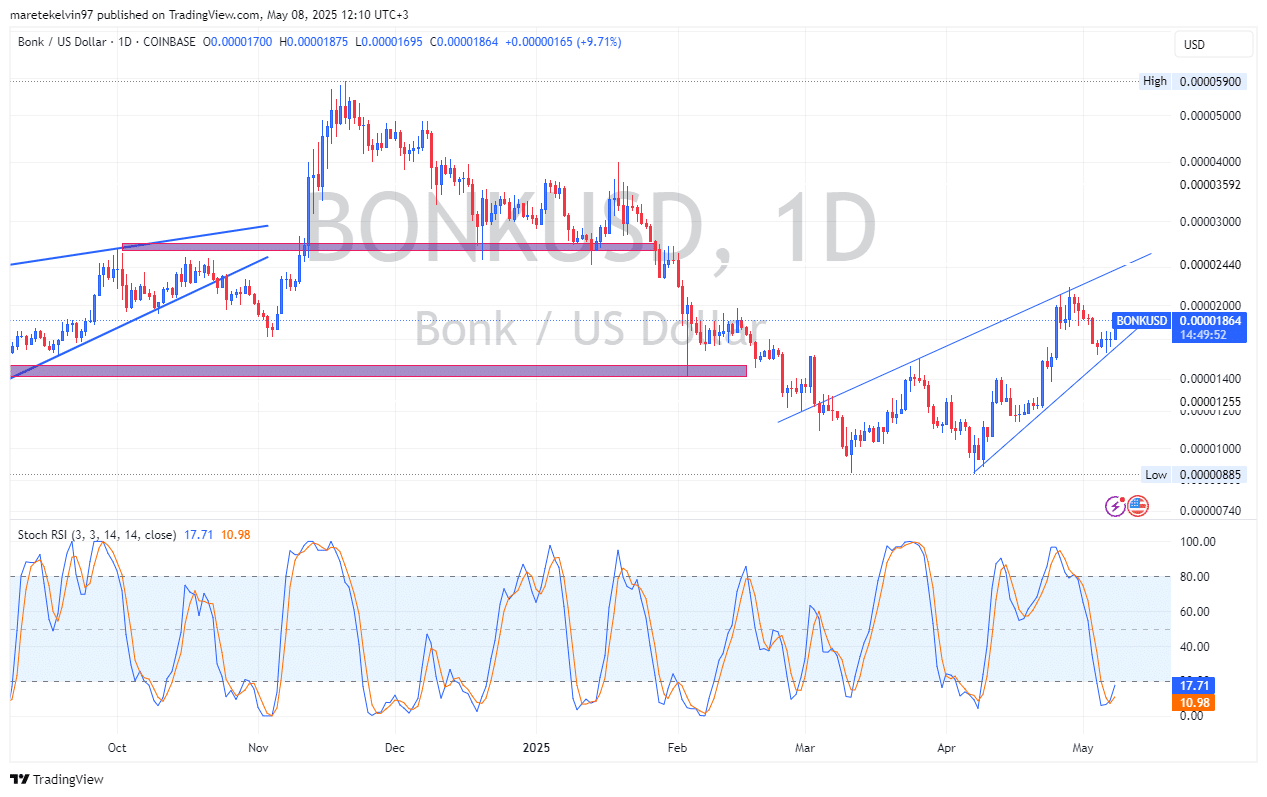
    Source: TradingView

    Stochastic RSI hints at potential reversal

    Technicals also align with this bullish outlook.

    The Stochastic RSI sat in an oversold region, as seen on the daily chart. This points to BONK’s reducing selling pressure and increased likelihood for a potential reversal.

    If BONK’s current bullish momentum holds, the wedge pattern may give way to a bullish breakout in the short run.

    On-chain metrics lean bullish

    On-chain metrics are in favor of BONK bulls. According to AMBCrypto’s analysis on CoinGlass data, the memecoin’s Weighted Funding Rates stayed neutral, between 0% and 0.02%, throughout the consolidation.

    The lack of over-leverage lowers the chances of violent liquidations disrupting a rally.
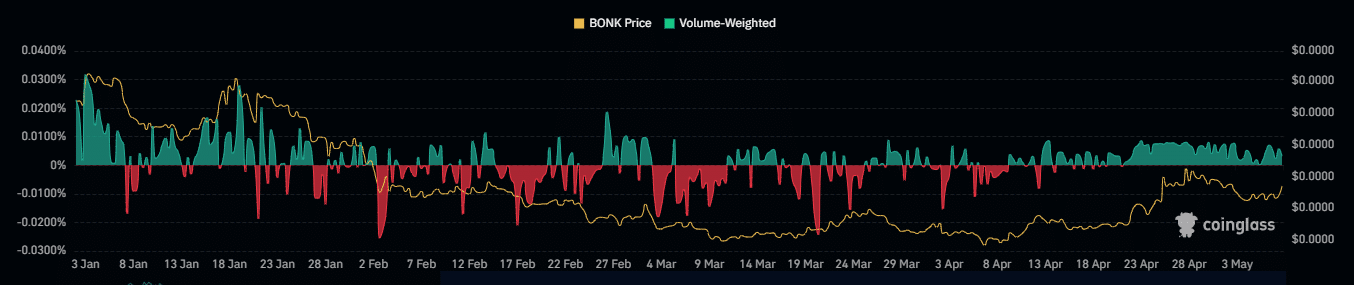
    Source: CoinGlass

    Also adding strength to the bullish argument are Liquidation Heatmaps.

    There are numerous liquidity clusters above the $0.00002 mark, which are points where the price can accelerate very fast if bulls manage to break this psychological resistance.
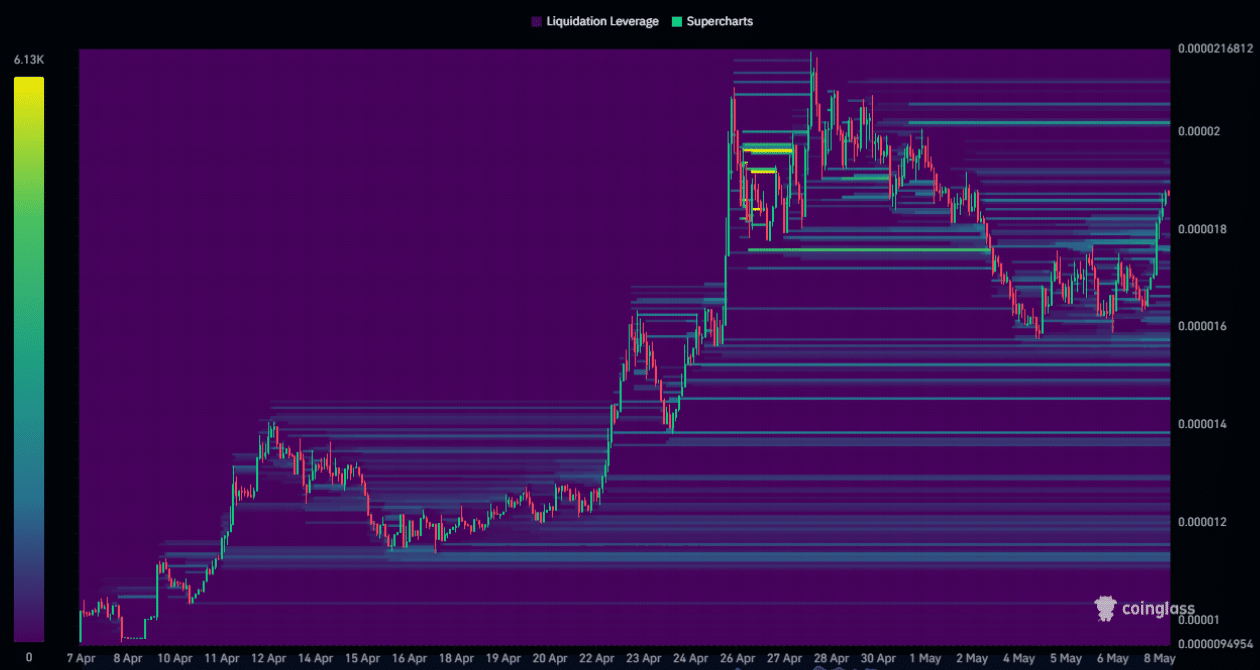
    Source: CoinGlass

    With price holding firm at wedge support, reversal signals flashing, and liquidity stacking above, the setup leans bullish.

    A breakout above $0.00002 could open the floodgates for BONK to test new resistance levels.

    Next: Ethereum’s staking surge: Is Pectra attracting more than just retail investors?

    Follow on Google News Follow on Flipboard
    Share. Facebook Twitter Pinterest LinkedIn Tumblr Email Copy Link
    Previous ArticleEthereum Poised For Strong Price Rebound Following Bullish Chart Pattern Breakout
    Next Article Weekly Update – New Voting Cycle, DeFiChain Anniversary, And More!
    Avatar
    Yeek.io
    • Website

    Yeek.io is your trusted source for the latest cryptocurrency news, market updates, and blockchain insights. Stay informed with real-time updates, expert analysis, and comprehensive guides to navigate the dynamic world of crypto.

    Related Posts

    Dogecoin faces a sell wall – Will smart money hold or fold at $0.17?

    June 7, 2025

    Analyzing Dogecoin’s price recovery odds in the wake of Trump-Musk spat

    June 7, 2025

    Examining PENGU’s 9% pump – Will spot sell pressure ruin the bullish setup?

    June 7, 2025
    Leave A Reply Cancel Reply

    Advertisement
    Demo
    Latest Posts

    Ethereum Prepares For A Parabolic Move – ETH/BTC Chart Signals Strong Bullish Setup

    Ethereum Enters Strategic Pause: Will Accumulation Below Resistance Spark A Surge?

    Solana indicators point north, bulls test $165 target

    Cardano is at the Nexus of Bitcoin DeFi: Charles Hoskinson

    Popular Posts
    Advertisement
    Demo
    X (Twitter) TikTok Instagram

    Categories

    • Altcoin
    • Bitcoin
    • Blockchain
    • Crypto News

    Categories

    • Defi
    • Ethereum
    • Meme Coins
    • Nfts

    Quick Links

    • Home
    • About
    • Contact
    • Privacy Policy

    Important Links

    • Crypto Chart
    • Crypto Price Chart
    © 2025 Yeek. All Copyright Reserved

    Type above and press Enter to search. Press Esc to cancel.