
- BRETT has a bullish swing structure on the 1-day chart.
- The increased selling pressure over the past five days showed that the memecoin could retrace further.
Brett [BRETT] saw a 10% drawdown in the previous 24 hours of trading. According to CoinMarketCap, its trading volume has fallen by 37%.
The Bitcoin [BTC] rally has slowed down over the past five days, with the king of crypto forming a short-term range.
A deeper dip for BTC could force alts to shed some of their gains. While BRETT showed strong demand in recent weeks, its chances of a drop toward $0.063 or lower were appreciable.
BRETT bulls defend the dynamic support at $0.0675
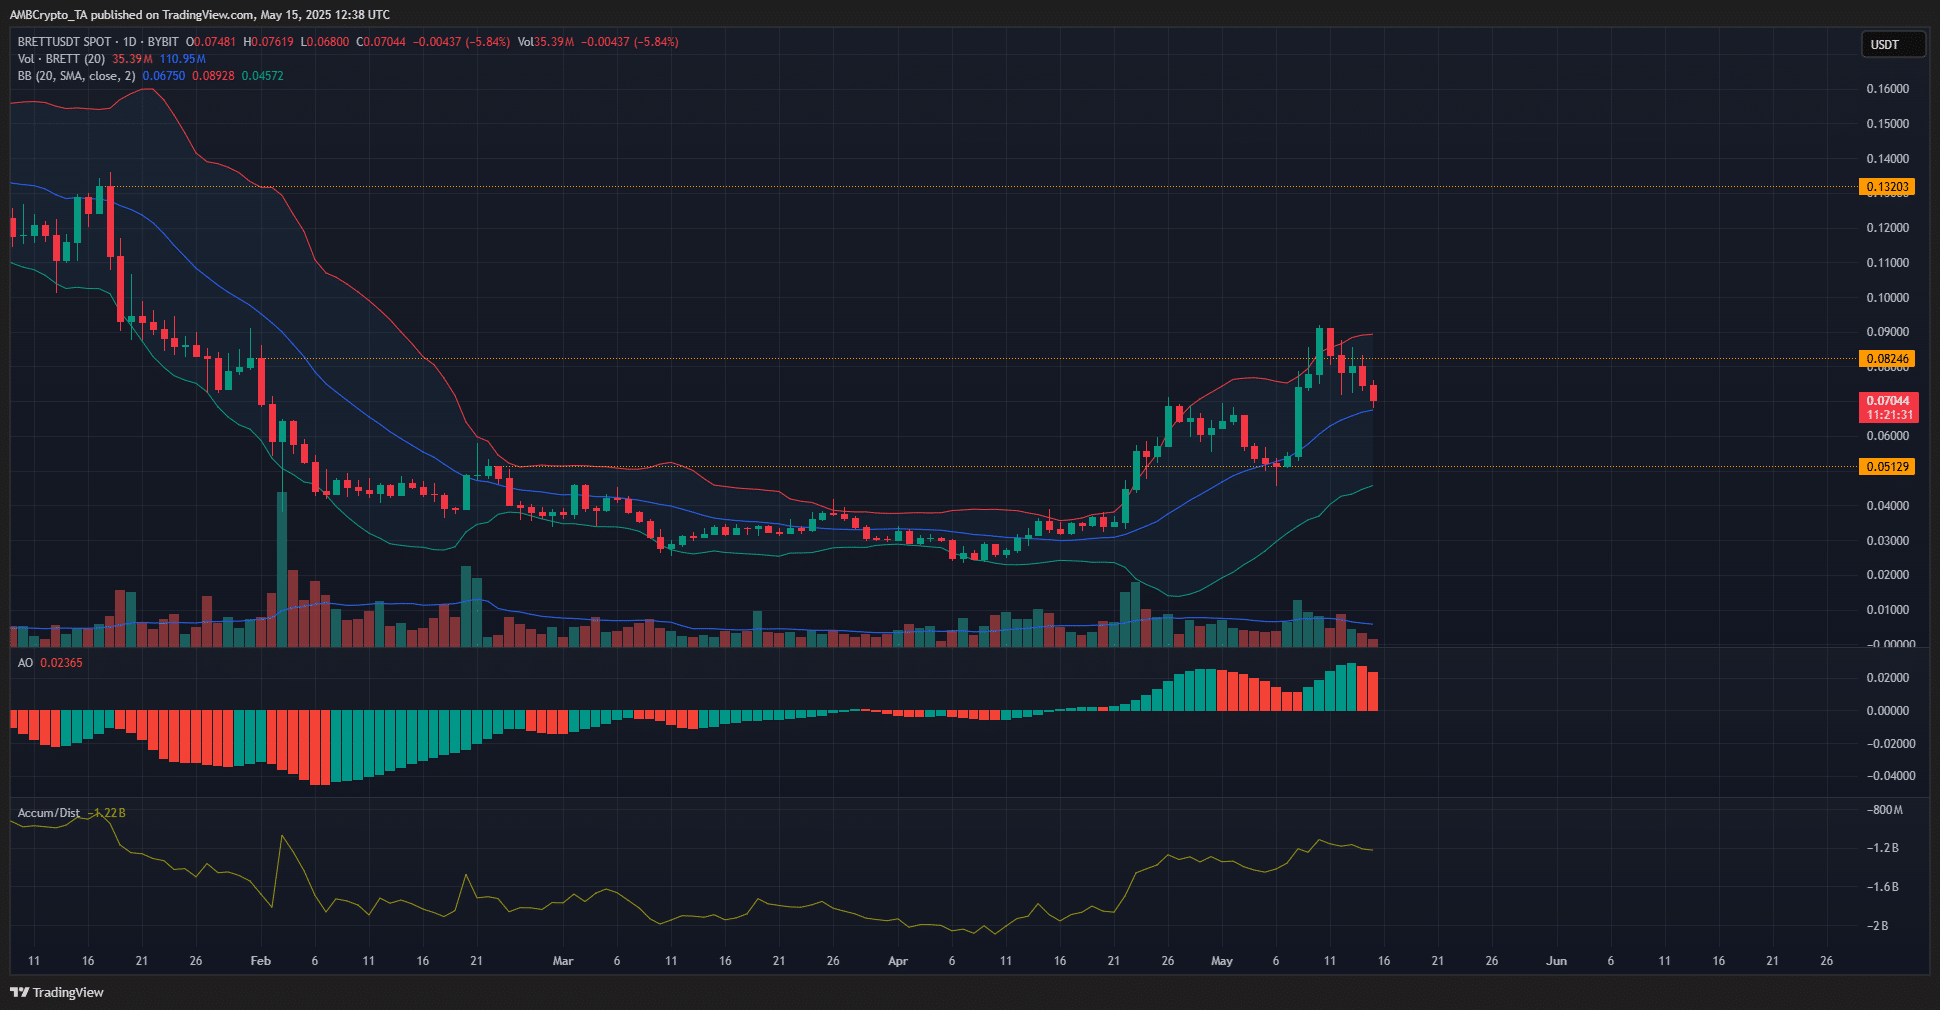
Source: BRETT/USDT on TradingView
On the 1-day timeframe, BRETT has a strongly bullish bias. It broke the $0.051 level and flipped it to support, and rallied 81% from this level in three days. Over the past five days, a 23% drawdown has occurred.
However, the Bollinger Bands showed that the recent correction came after the price burst past the upper band. At press time, BRETT was back at the 20-day moving average.
If this dynamic support could be defended, a move beyond the $0.082 would be more likely.
The A/D indicator has trended higher over the past three weeks, reflecting increased buying pressure. This has driven the memecoin’s rally, after its consolidation phase from February to April.
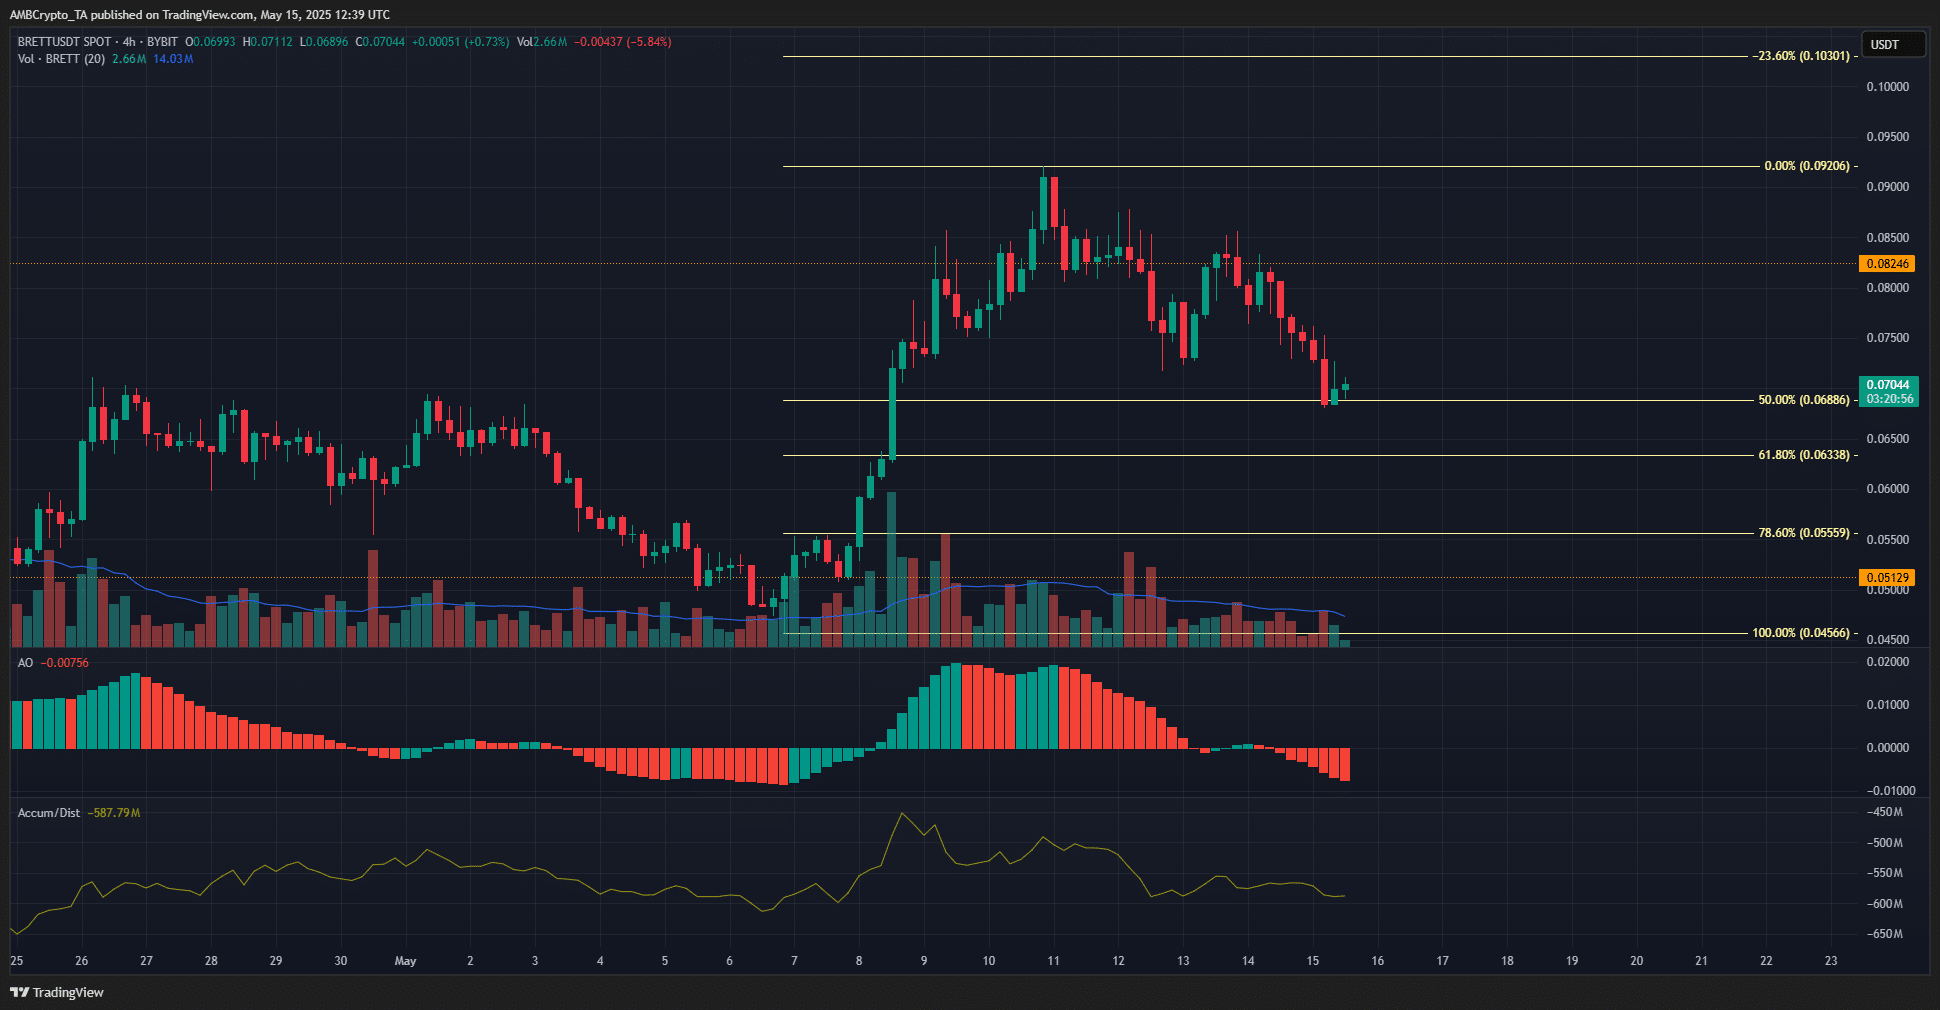
Source: BRETT/USDT on TradingView
On the 4-hour chart, a set of Fibonacci retracement levels was plotted based on the rally from $0.045 to $0.092. The 50% retracement level at $0.0688 was being tested as support at press time.
The Awesome Oscillator showed that the momentum had flipped bearishly. With its histogram bars printing red, it underlined the downward impulse of the past couple of days.
The A/D indicator, which had been trending upward on the daily timeframe, showed a sizeable dip on the 4-hour chart. It was back at the previous week’s lows. This suggested that BRETT might see a deeper retracement.
In that case, the $0.0633 and $0.056 levels were the next support levels to watch out for.
Disclaimer: The information presented does not constitute financial, investment, trading, or other types of advice and is solely the writer’s opinion