
- BRETT rose 2.32% in 24 hours, but volume fell 9.62% to $61M, indicating a weakening uptrend.
- Bullish sentiment, particularly in the spot market, has kept the memecoin trending upward against the odds.
Over the last 24 hours, Brett [BRETT] recorded a modest 2.32% gain.
However, the accompanying decline in market volume—down 9.62% to $61 million—adds a layer of caution to the current uptrend.
The shrinking volume points to a cooling market environment, with limited signs of an imminent breakout or breakdown. This mirrors the broader indecision visible in current price action.
AMBCrypto analyzes the factors around BRETT’s indecisive market stance.
Is this roadblock enough to halt BRETT?
BRETT’s upward move can be linked to its position within a bullish pattern known as the ascending channel.
This pattern forms when the memecoin’s price continues to rise within a defined zone on the chart before retracing to the start of the channel.
Analysis shows that this drop to the bottom of the channel could occur sooner, as the memecoin is now trading within a key resistance range.
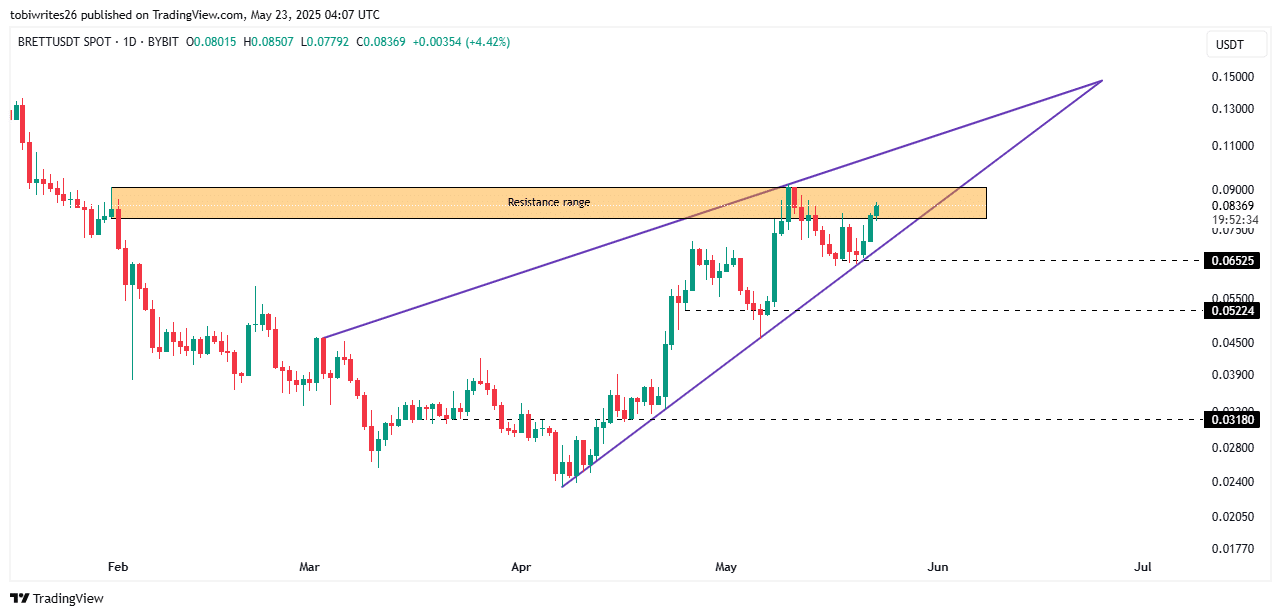
Source: TradingView
The combination of the ascending channel and resistance range could send the asset to one of three targets: $0.065, $0.052, or $0.031.
These areas represent potential levels for a market rebound, offering a catalyst for the asset to trend higher.
Where does the market indicators stand?
Indicators show a clear stance; they point to a bearish tilt among traders.
The Aroon Down line stood at 57.14%, well above the Aroon Up’s 7.14%, pointing to growing downside pressure.
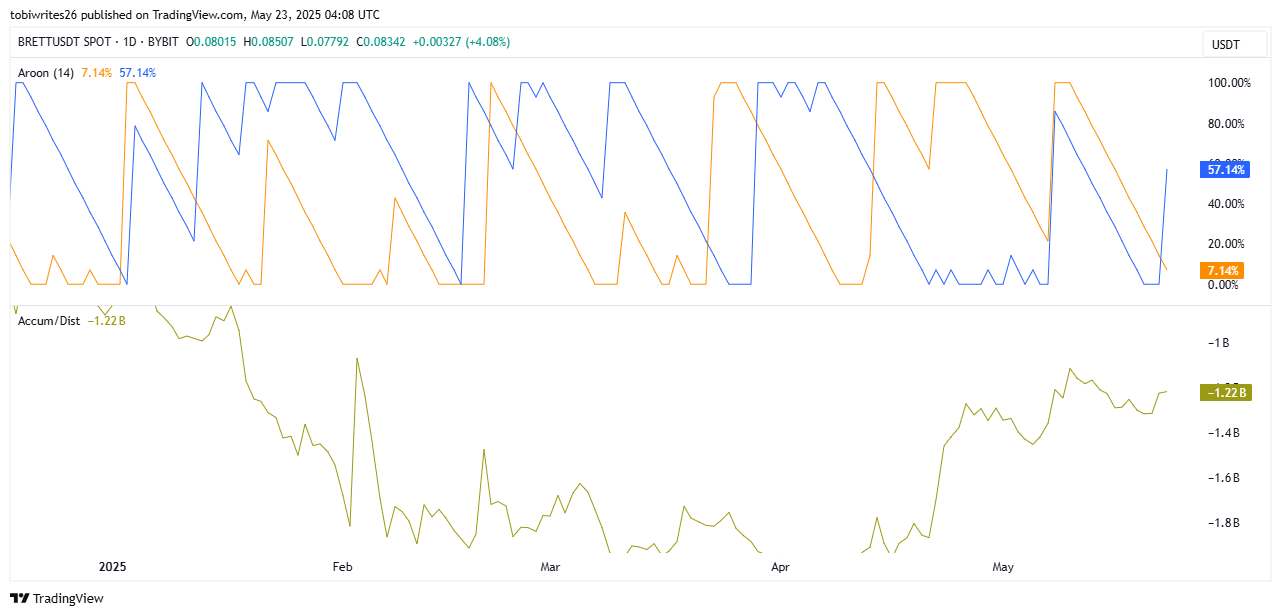
Source: TradingView
If this percentage gap widens to a full divergence, with the Aroon Down at 100.00% and the Aroon Up at 0.00%, it would suggest that BRETT has shifted heavily toward bearish momentum.
Concurrently, the Accumulation and Distribution (A/D) indicator shows that distribution has begun. The A/D ratio is still in negative territory, which indicates that sellers remain active in the market.
However, its upward movement also suggests fewer sellers compared to the previous day, when the asset had yet to rally.
Is this a good sign for BRETT investors?
Despite bearish indicators, buyers remain active. The A/D indicator hinting at active sellers aligns with the bullish trend in both the spot and futures markets.
In the spot market, the second-largest purchase of the year occurred the previous day, valued at $1.53 million.
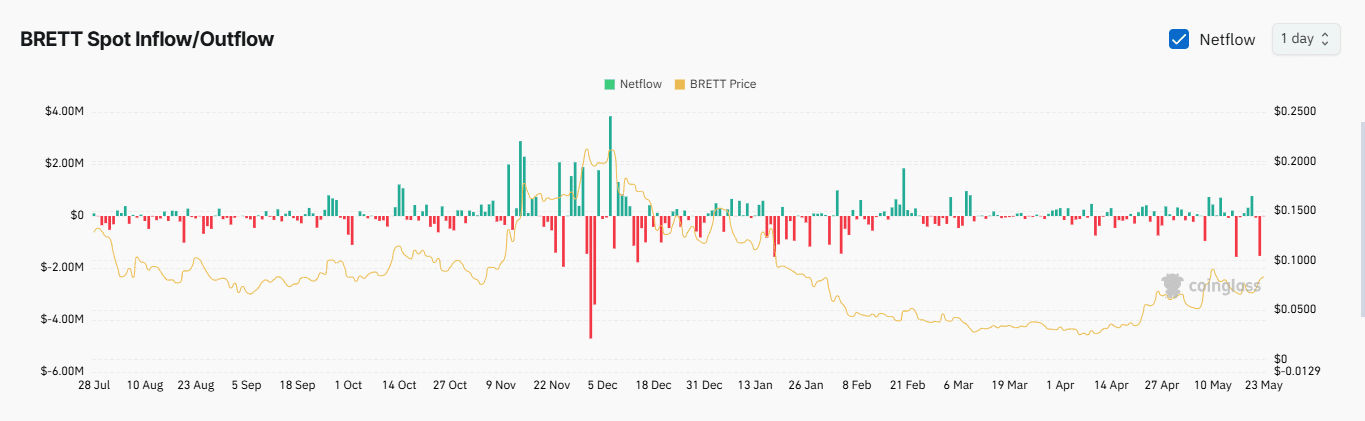
Source: CoinGlass
At press time, traders spent $181,000 purchasing BRETT, another sign of a potential market rally.
In the derivatives market, long positions continue to dominate, with most open positions coming from traders betting long. The Open Interest-Weighted Funding Rate, which has been climbing, confirms this.
As of this writing, the metric was at 0.0236%, which suggests that more traders opening positions on BRETT expect a rally.
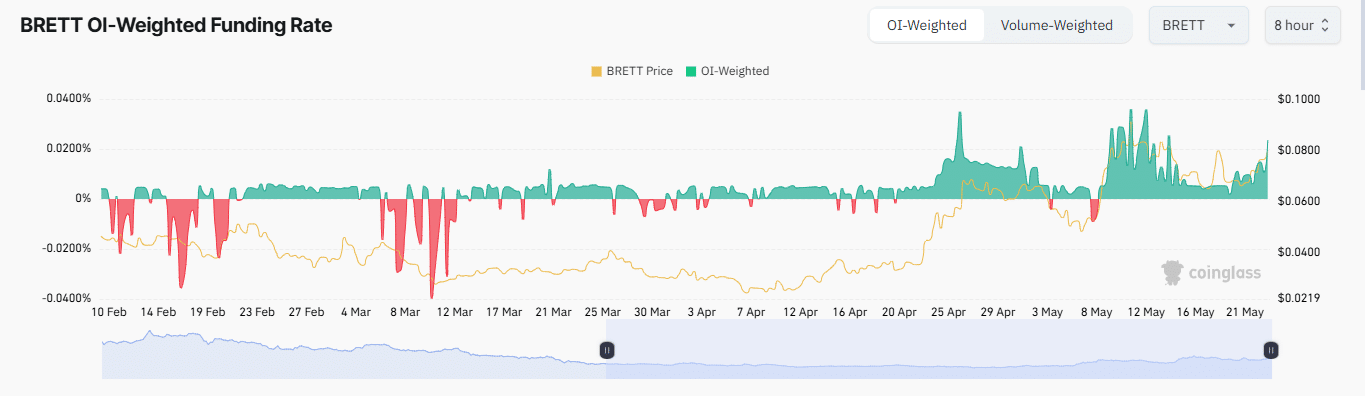
Source: CoinGlass
BRETT’s current situation shows that the market remains balanced. The asset is likely to maintain a neutral stance until a more decisive move emerges from either buyers or sellers.