
- SHIB was trading at the support level of a bullish pattern and aligning with its expected technical support movement.
- The memecoin’s performance over the past week could potentially limit its upward move.
Despite staying within a bullish territory, Shiba Inu [SHIB] declined by 11.88% over the past week. Analysis suggests this decline may be coming to a halt as multiple bullish confluences begin to surface.
Notably, liquidity inflows are gradually increasing, and with a supportive bullish pattern, the asset shows potential for an upward move.
Bullish pattern – How will it play out for SHIB?
SHIB’s continued decline has brought it to the support level of a bullish triangle pattern.
This bullish triangle features price movement constrained within a descending resistance line and a horizontal support level.
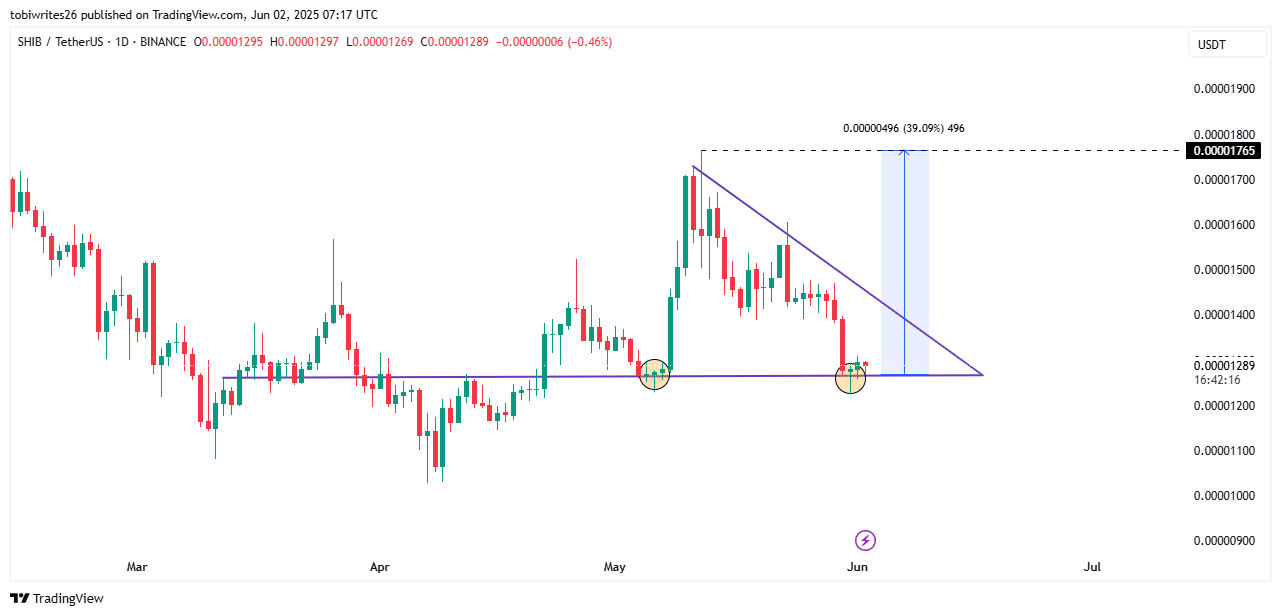
Source: TradingView
Typically, after an extended period of consolidation, assets break out of such patterns through the resistance line. In SHIB’s case, a breakout could result in a 39% rally, pushing the price to $0.00001765.
However, SHIB must breach the resistance level with at least one confirmed candle close above it to validate the next price target.
More bullish confluences surface
Market indicators suggest that SHIB has a higher potential to rally, based on technical metrics such as the Bollinger Bands and the Money Flow Index.
The Bollinger Bands (BB), which help gauge whether an asset is overbought or oversold, indicate a possible rally. At the time of writing, SHIB was trading near the lower band, signaling oversold conditions—often a precursor to buyer interest.
This lower BB band also aligns with the key support level shown on the chart, adding further credibility to the pattern.
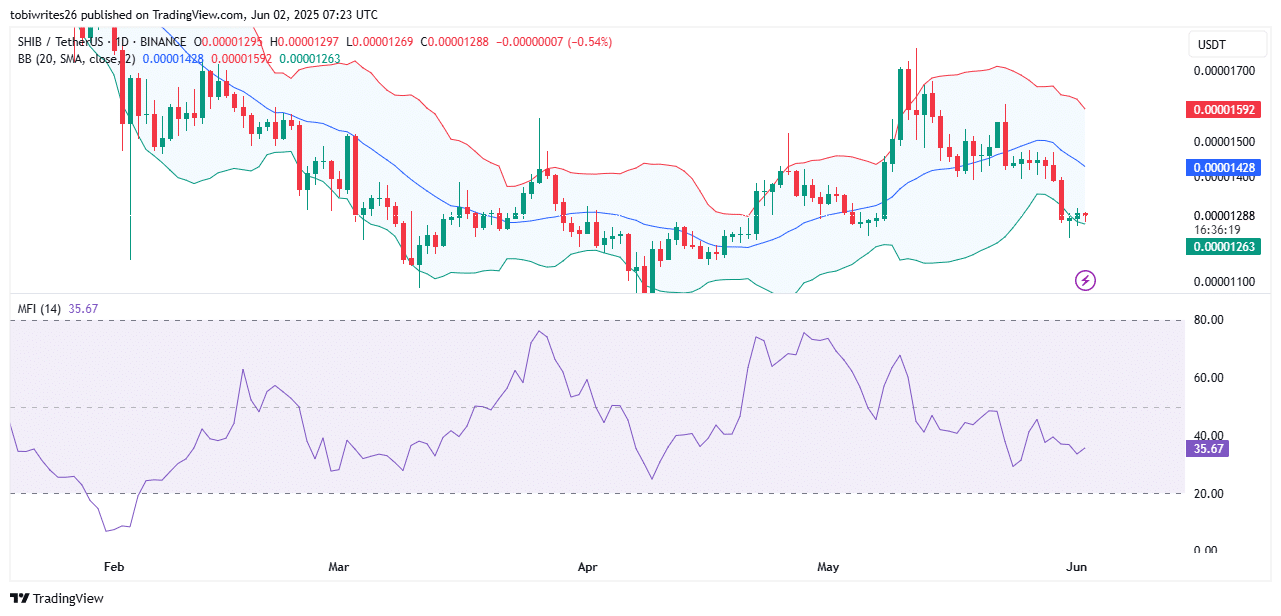
Source: TradingView
Supporting the case for a potential rally is the increasing liquidity inflow into SHIB. At press time, the Money Flow Index (MFI) was at 35.67 and trending upward.
If this upward trend continues—especially if the MFI crosses above 50—it would indicate a strong liquidity inflow into the asset, signaling bullish momentum.
Still, the question remains: Are the bulls fully committed to SHIB, or is this only a temporary performance?
Are bulls fully in the market?
Analysis of the broader memecoin market suggests that bullish momentum is not yet fully established, as the sector continues to show weakness.
Data from Artemis reveals that over the past seven days, memecoins have underperformed, dropping by 15.2%. This decline places the sector among the bottom four performers across all ecosystems.
This drop into the bottom quartile suggests a liquidity outflow from the broader memecoin market.

Source: Artemis
While this performance metric represents a weighted average and doesn’t directly determine Shiba Inu’s liquidity inflows, it still offers valuable insight.
If the memecoin sector starts to recover and exits this negative zone, it could signal a return of overall liquidity—potentially attracting more capital to SHIB.