Close Menu
    What's Hot

    SIREN crashes 54%, wipes out $1.2 bln market cap – What’s next?

    TRUMP faces $23.18 mln supply shock: Will price break down under pressure?

    MemeCore: How M could target $2.57 after 107% volume spike

    Facebook X (Twitter) Instagram
    yeek.io
    • Crypto Chart
    • Crypto Price Chart
    X (Twitter) Instagram TikTok
    Trending Topics:
    • Altcoin
    • Bitcoin
    • Blockchain
    • Crypto News
    • DeFi
    • Ethereum
    • Meme Coins
    • NFTs
    • Web 3
    yeek.io
    • Altcoin
    • Bitcoin
    • Blockchain
    • Crypto News
    • DeFi
    • Ethereum
    • Meme Coins
    • NFTs
    • Web 3
    Meme Coins

    Dogecoin price prediction – Why the $0.21-level may be key for a reversal

    Yeek.ioBy Yeek.ioJune 24, 2025No Comments2 Mins Read
    Share Facebook Twitter Pinterest Copy Link Telegram LinkedIn Tumblr Email
    Share
    Facebook Twitter LinkedIn Pinterest Email
    • Dogecoin price action has been bearish, with the same falling below May’s low
    • The $0.21 zone must be flipped to support before long-term bias can shift bullishly

    Dogecoin [DOGE] has been on a steady downtrend over the past five weeks. The leading memecoin erased the 58% rally it made in the second week of May and fell below its May low on 20 June.

    In a recent report, AMBCrypto highlighted Dogecoin’s blueprint. The gains made in April and May could just be the prologue before a parabolic rally.

    In fact, the exchange netflows metric has been negative over the past two weeks – A sign of DOGE accumulation.

    Dogecoin holders need not panic yet
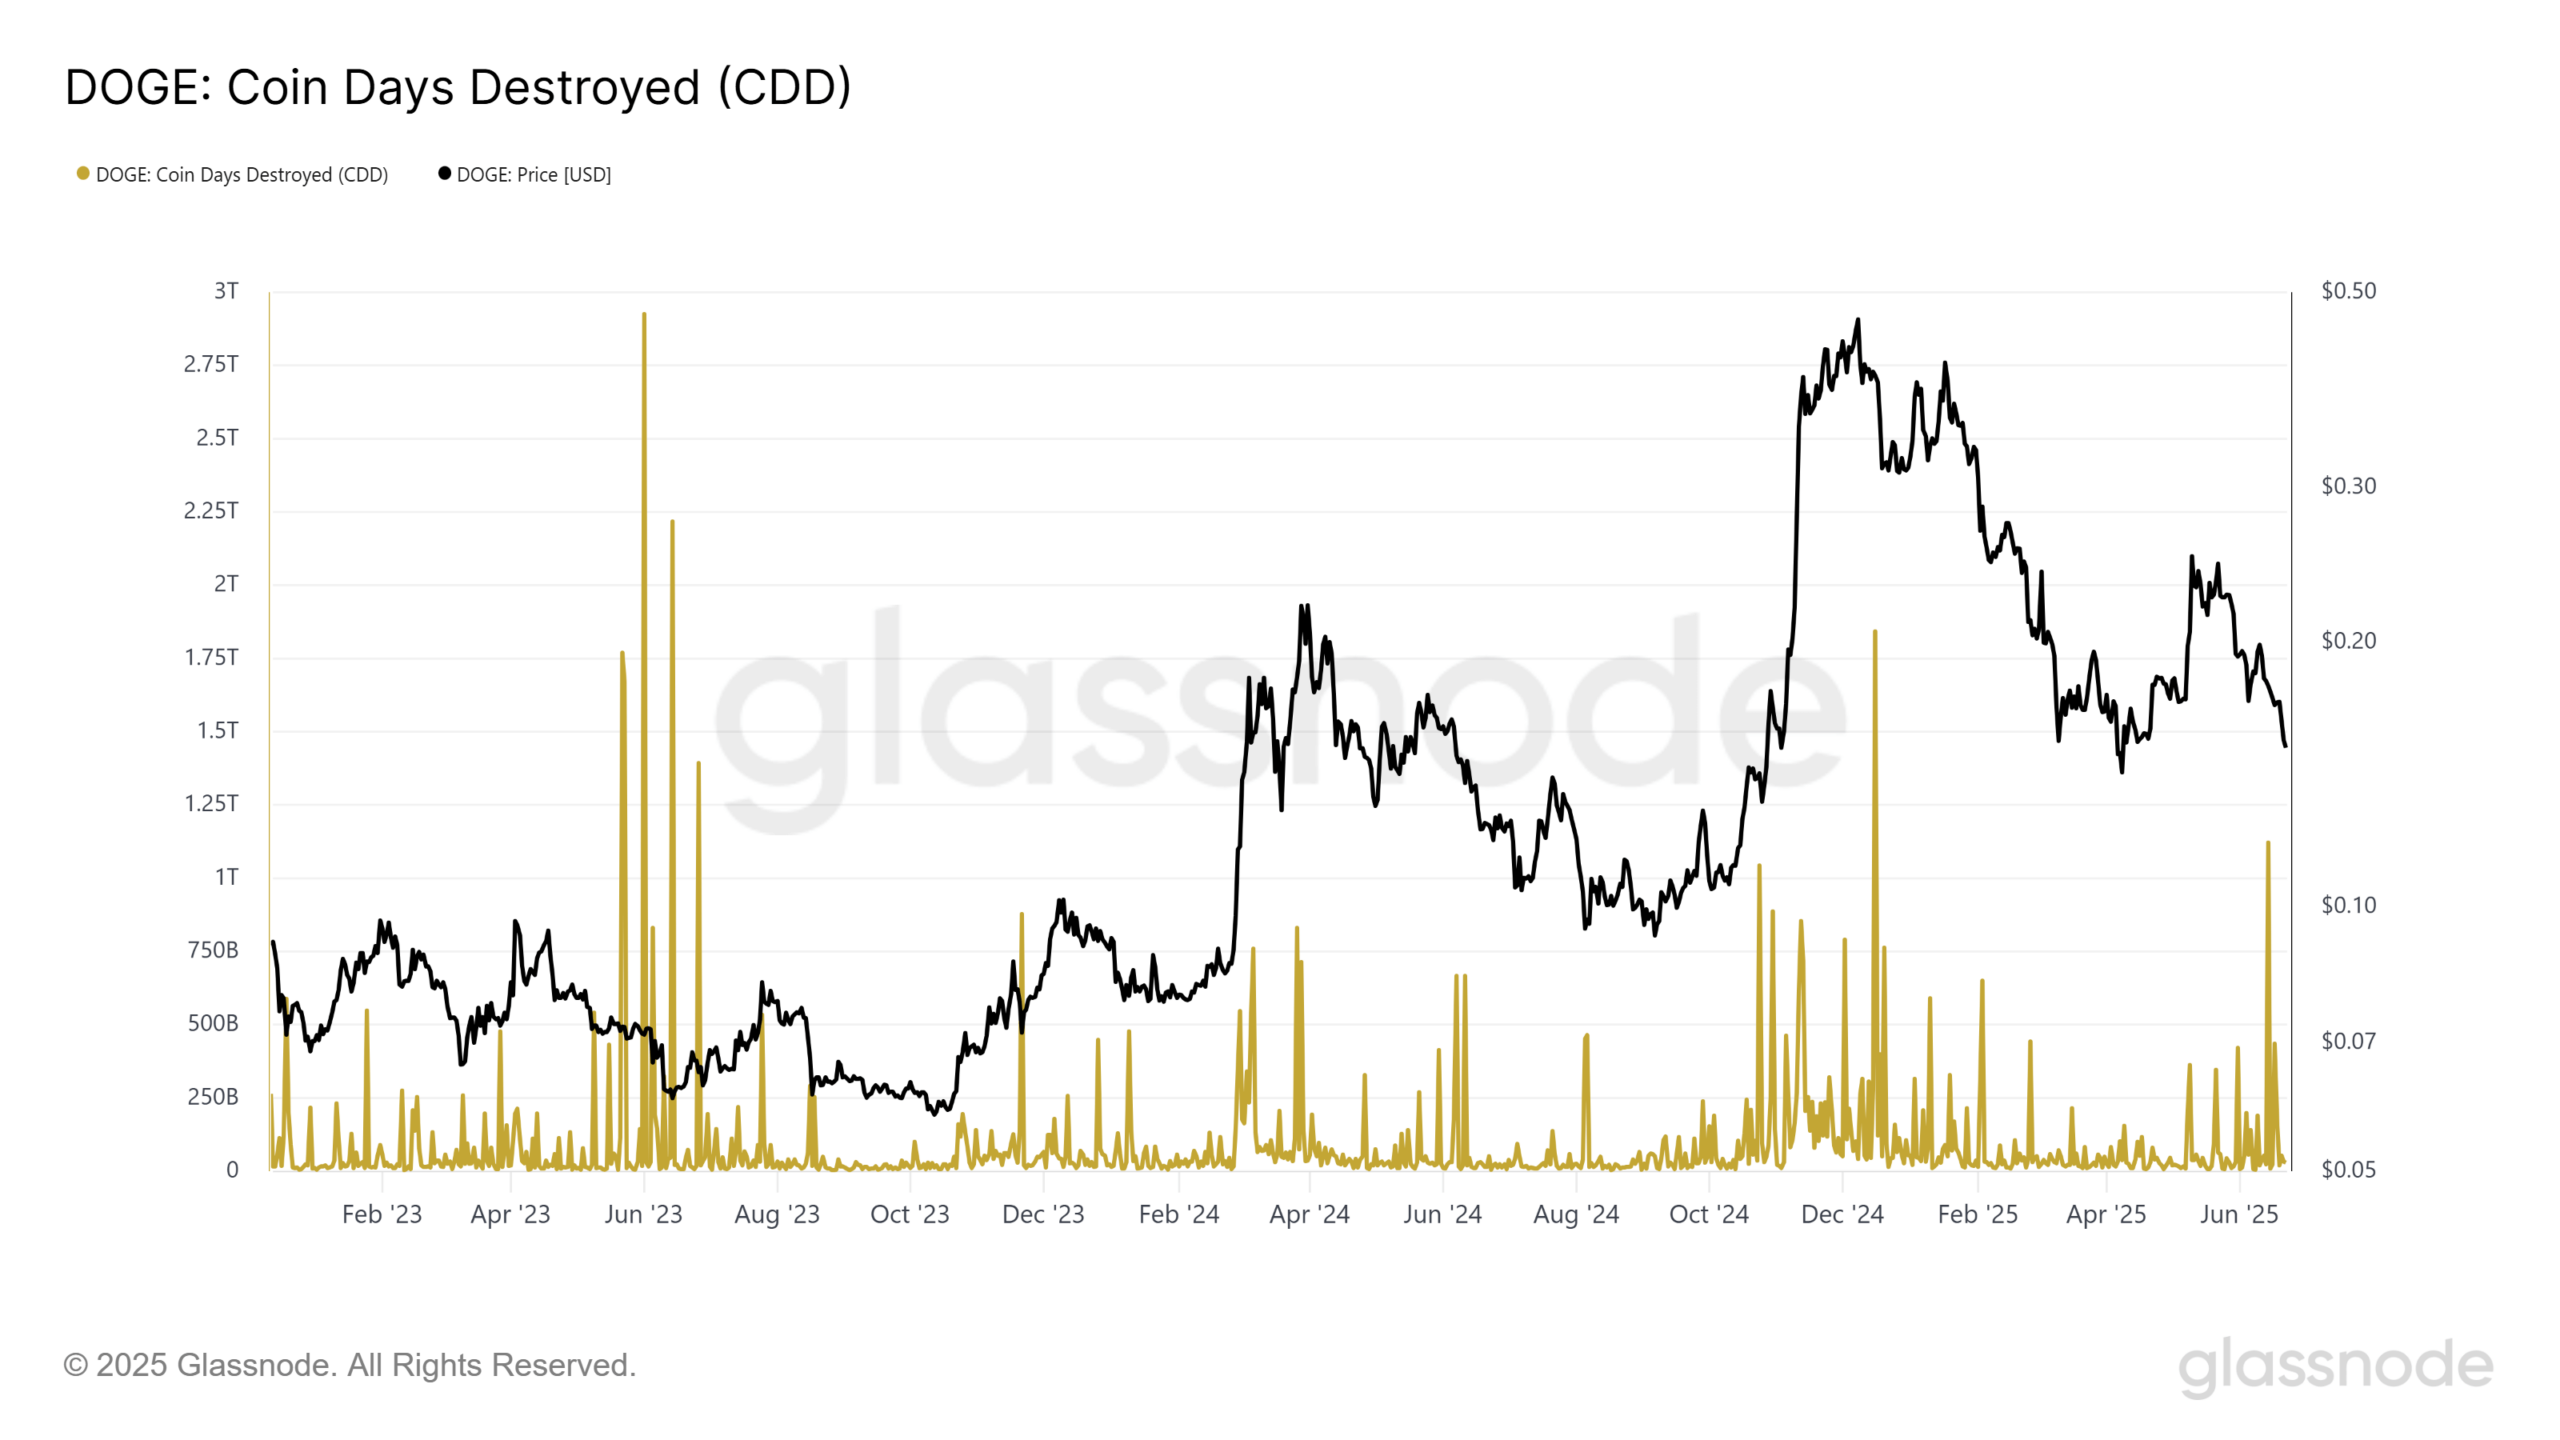
    DOGE Coin Days Destroyed

    Source: Glassnode

    Dogecoin saw a large spike on the coin days destroyed metric on 14 June, and another sizeable one on 17 June. It reflected a notable hike in the amount of old coins being transacted and indicated selling pressure.

    However, the latest CDD uptick is not yet a sustained trend, like it was in November-December 2024 or June-July 2023. Therefore, it may be too early to conclude that there is persistent distribution on-chain, which would point towards capitulation (like 2023) or heavy profit-taking (like late 2024).
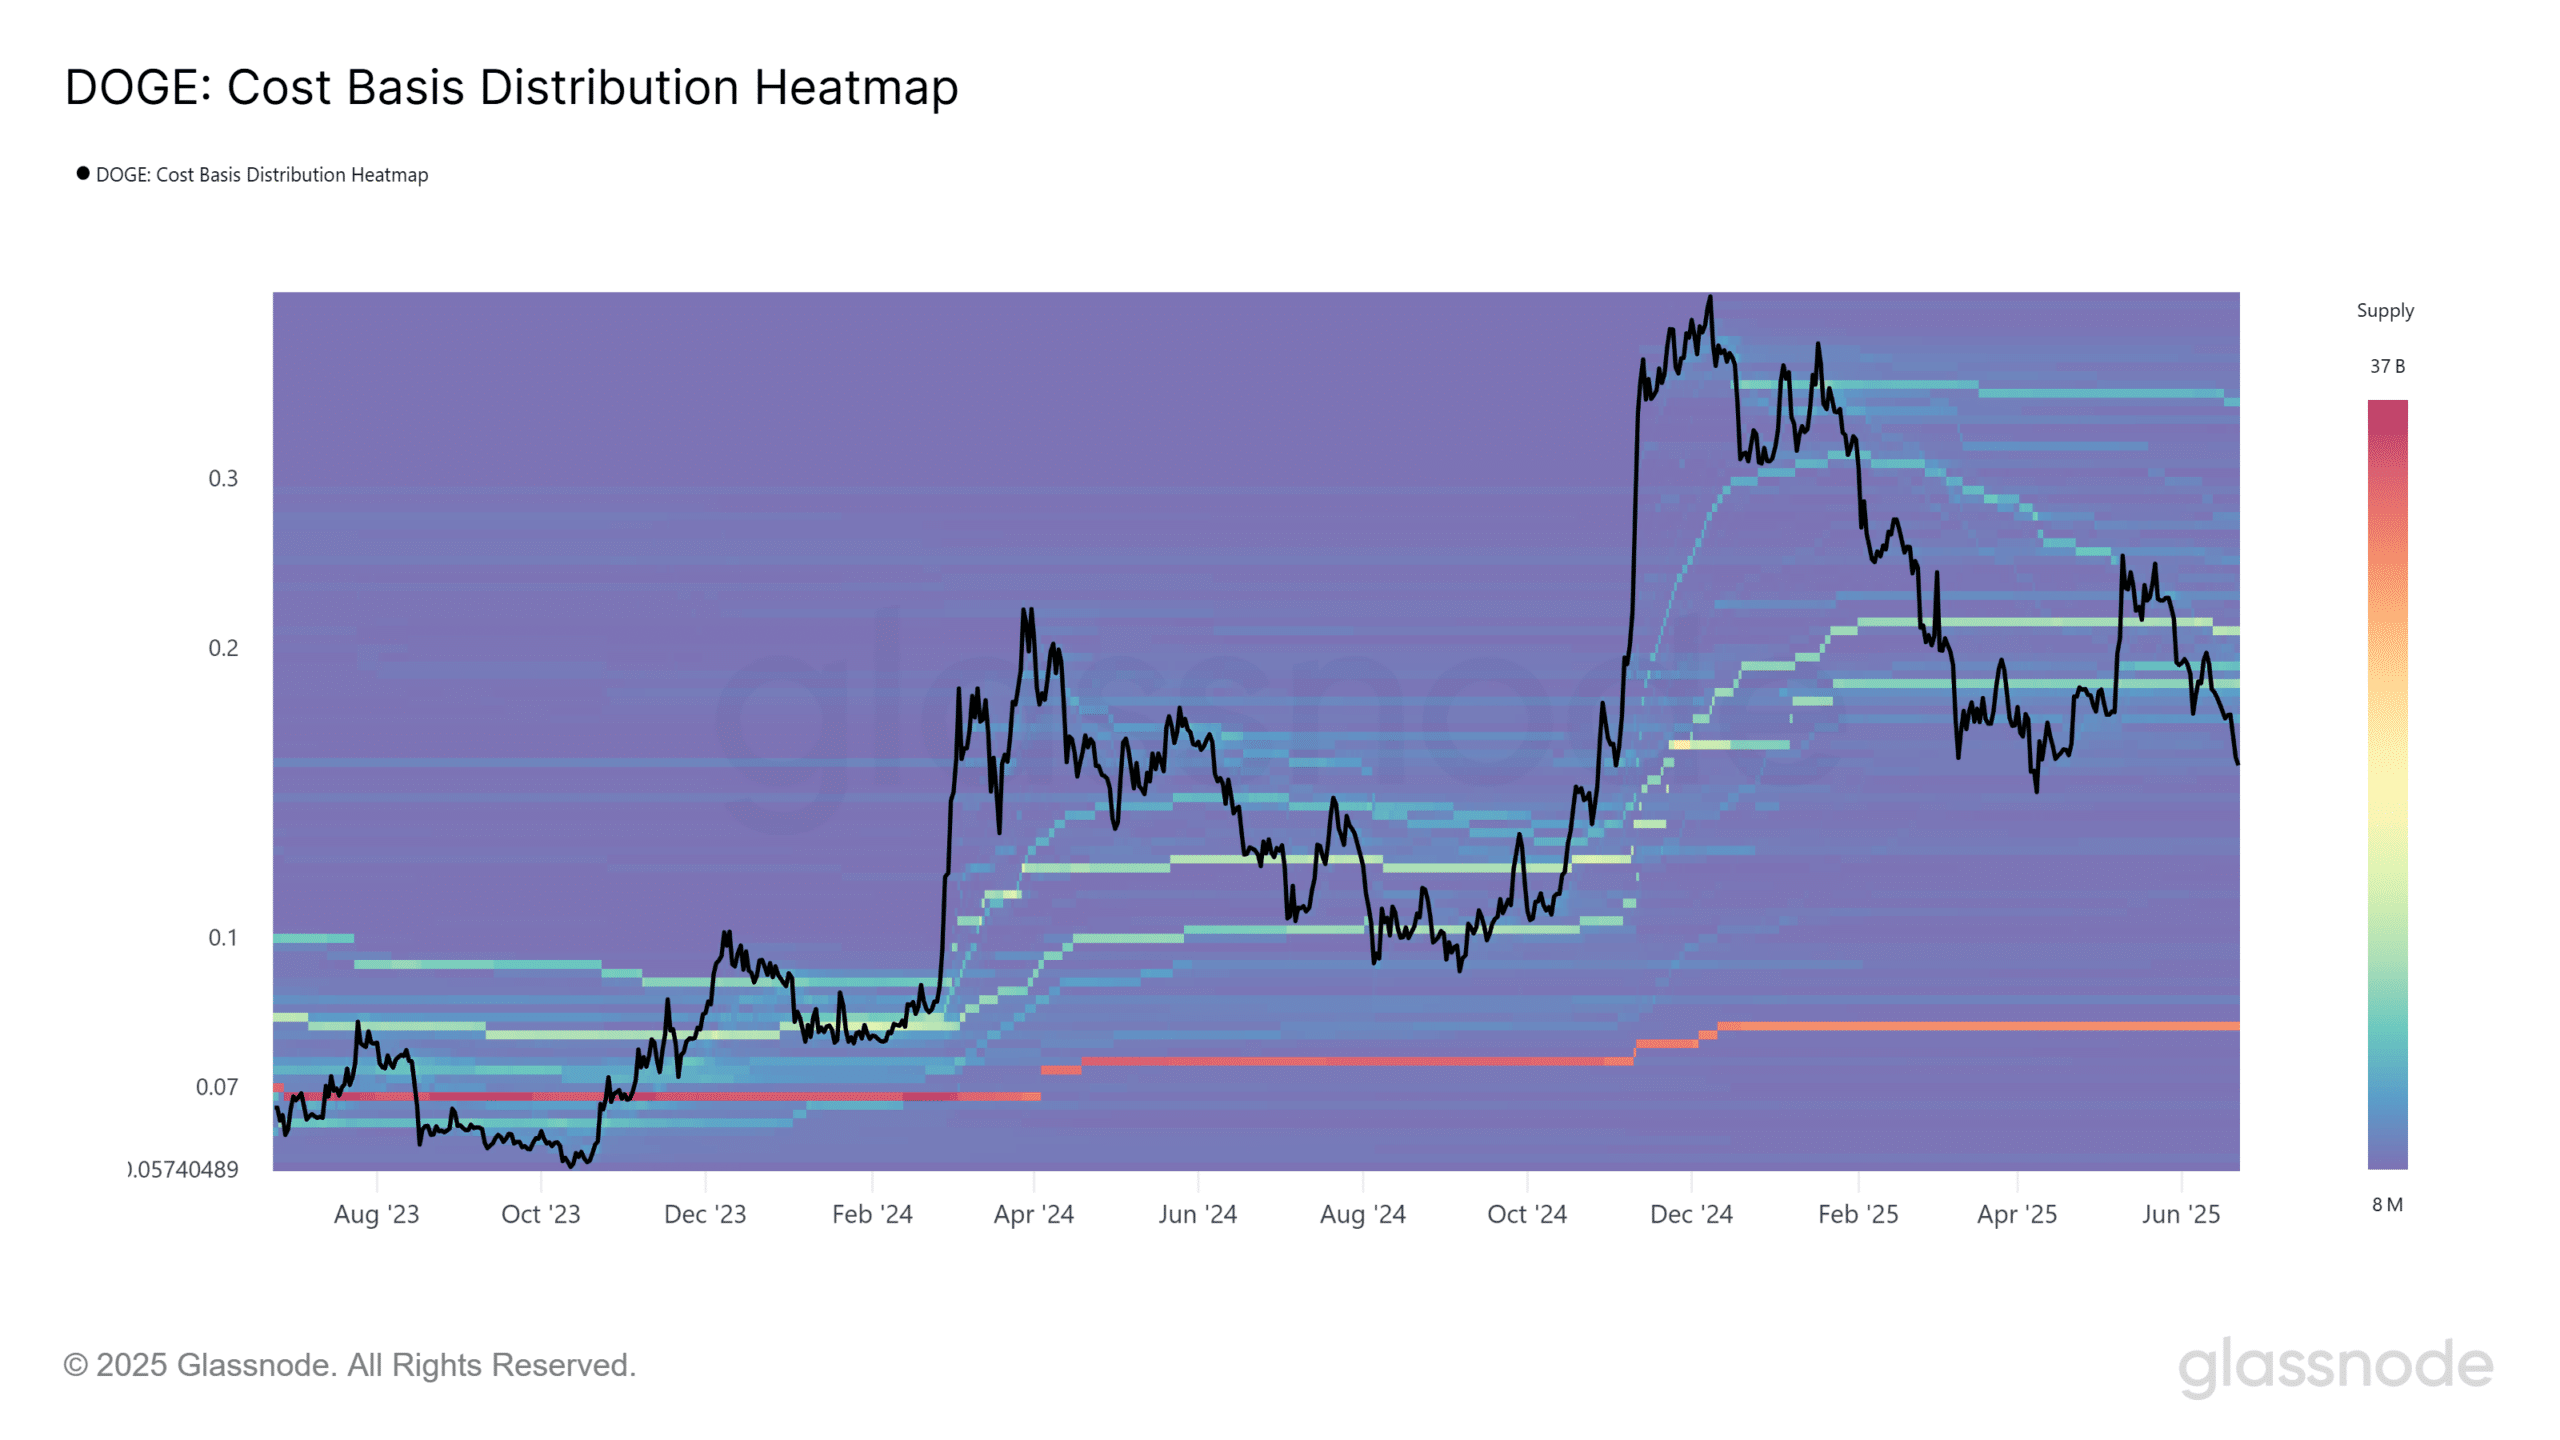
    DOGE CBD HeatmapDOGE CBD Heatmap

    Source: Glassnode

    The cost basis distribution (CBD) heatmap is a visualization of Dogecoin’s supply density at various price levels over a period of time. Warmer colors imply higher supply and reflect strong supply/demand zones.

    The $0.182-$0.211 area had three distinct bands of supply. They tried and failed to hold back the DOGE bears. This means that if Dogecoin recovers, fearful holders might choose to exit at break-even at these levels, which could make a stronger recovery tougher.

    In August-September 2024, the price fell below key demand zones, but was able to recover a couple of months later. There is hope that a similar scenario might play out in the coming months, especially considering the exchange outflows seen over the past two weeks.

    Next: How low will the Crypto Fear & Greed Index go before Bitcoin recovers?

    Follow on Google News Follow on Flipboard
    Share. Facebook Twitter Pinterest LinkedIn Tumblr Email Copy Link
    Previous ArticleEthereum Eyes Breakout Toward $4,204 With Key Technical Formation In Play
    Next Article Democrats unveil COIN Act to block Trump and public officials from profiting off crypto
    Avatar
    Yeek.io
    • Website

    Yeek.io is your trusted source for the latest cryptocurrency news, market updates, and blockchain insights. Stay informed with real-time updates, expert analysis, and comprehensive guides to navigate the dynamic world of crypto.

    Related Posts

    SIREN crashes 54%, wipes out $1.2 bln market cap – What’s next?

    March 27, 2026

    TRUMP faces $23.18 mln supply shock: Will price break down under pressure?

    March 27, 2026

    MemeCore: How M could target $2.57 after 107% volume spike

    March 27, 2026
    Leave A Reply Cancel Reply

    Advertisement
    Demo
    Latest Posts

    SIREN crashes 54%, wipes out $1.2 bln market cap – What’s next?

    TRUMP faces $23.18 mln supply shock: Will price break down under pressure?

    MemeCore: How M could target $2.57 after 107% volume spike

    PIPPIN crashes 33% in a day: What triggered the sell-off?

    Popular Posts
    Advertisement
    Demo
    X (Twitter) TikTok Instagram

    Categories

    • Altcoin
    • Bitcoin
    • Blockchain
    • Crypto News

    Categories

    • Defi
    • Ethereum
    • Meme Coins
    • Nfts

    Quick Links

    • Home
    • About
    • Contact
    • Privacy Policy

    Important Links

    • Crypto Chart
    • Crypto Price Chart
    © 2026 Yeek. All Copyright Reserved

    Type above and press Enter to search. Press Esc to cancel.