
Ethereum (ETH) appears to have ‘bottomed out,’ according to crypto analyst Mister Crypto. The analyst shared this observation as investor confidence in ETH continues to wane due to the digital asset’s relatively lackluster price performance in 2024.
Is Ethereum Due For A Rally?
Unlike Bitcoin (BTC) and Solana (SOL), which have surged in the past year by 146% and 154%, respectively, Ethereum has risen a modest 32% over the same period. As a result, ETH holders are understandably frustrated with the digital asset’s price action, with some whales liquidating their holdings at losses of up to $1 million.
Related Reading
However, some analysts now believe it may finally be time for Ethereum to break out of its stagnation. Crypto trader Mister Crypto shared the following ETH/BTC monthly chart on X, showing ETH’s price bouncing off a long-standing trendline before entering a parabolic run.
This analysis aligns with a recent report highlighting ETH’s four-year low of 0.031 against BTC on the weekly chart. A potential rebound from this multi-year support level could position ETH to outperform BTC in the short term.
Crypto analyst Merlijn The Trader also identified a bullish falling wedge pattern forming on Ethereum’s 2-day chart. According to Merlijn, a breakout to the upside could make Ethereum’s next move “legendary.”
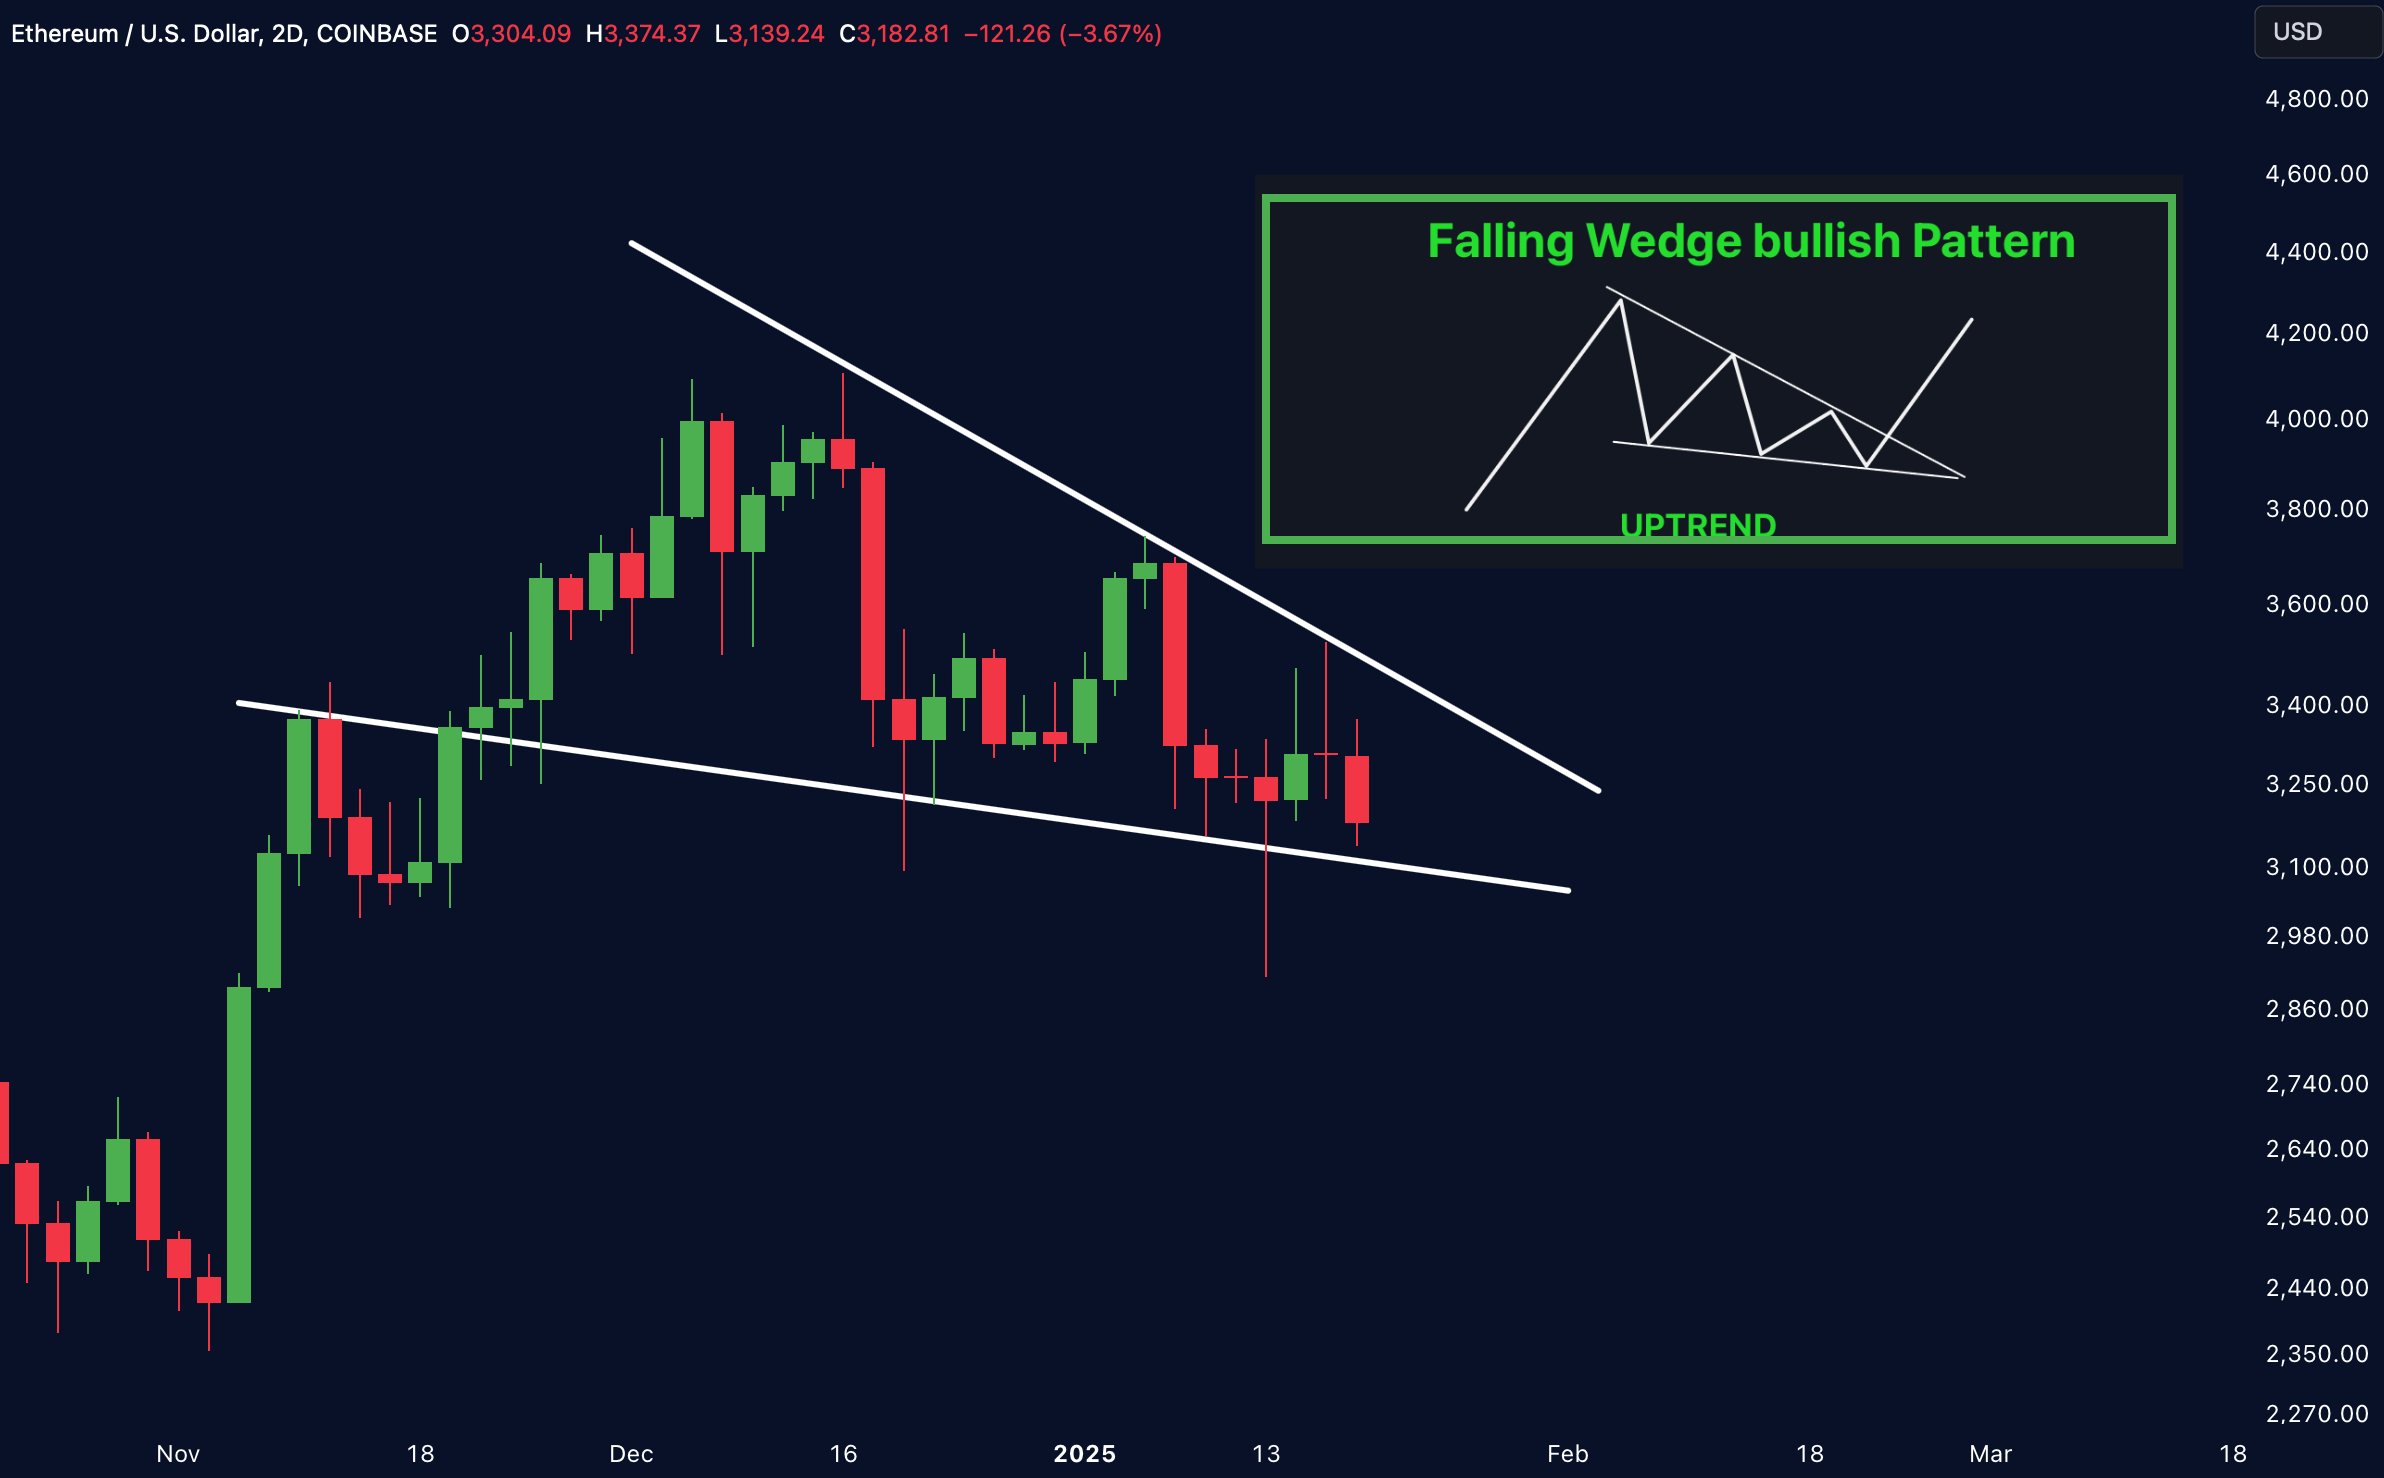
For the uninitiated, a bullish falling wedge is a technical chart pattern that forms when an asset’s price consolidates between two downward-sloping, converging trendlines. It typically signals a potential trend reversal or continuation, with a breakout to the upside expected once the price moves above the upper trendline.
In Ethereum’s case, its price must decisively break through the $3,400 level to confirm the bullish falling wedge pattern. Failure to do so could result in ETH falling to the next major support levels at $3,000 and potentially $2,400.
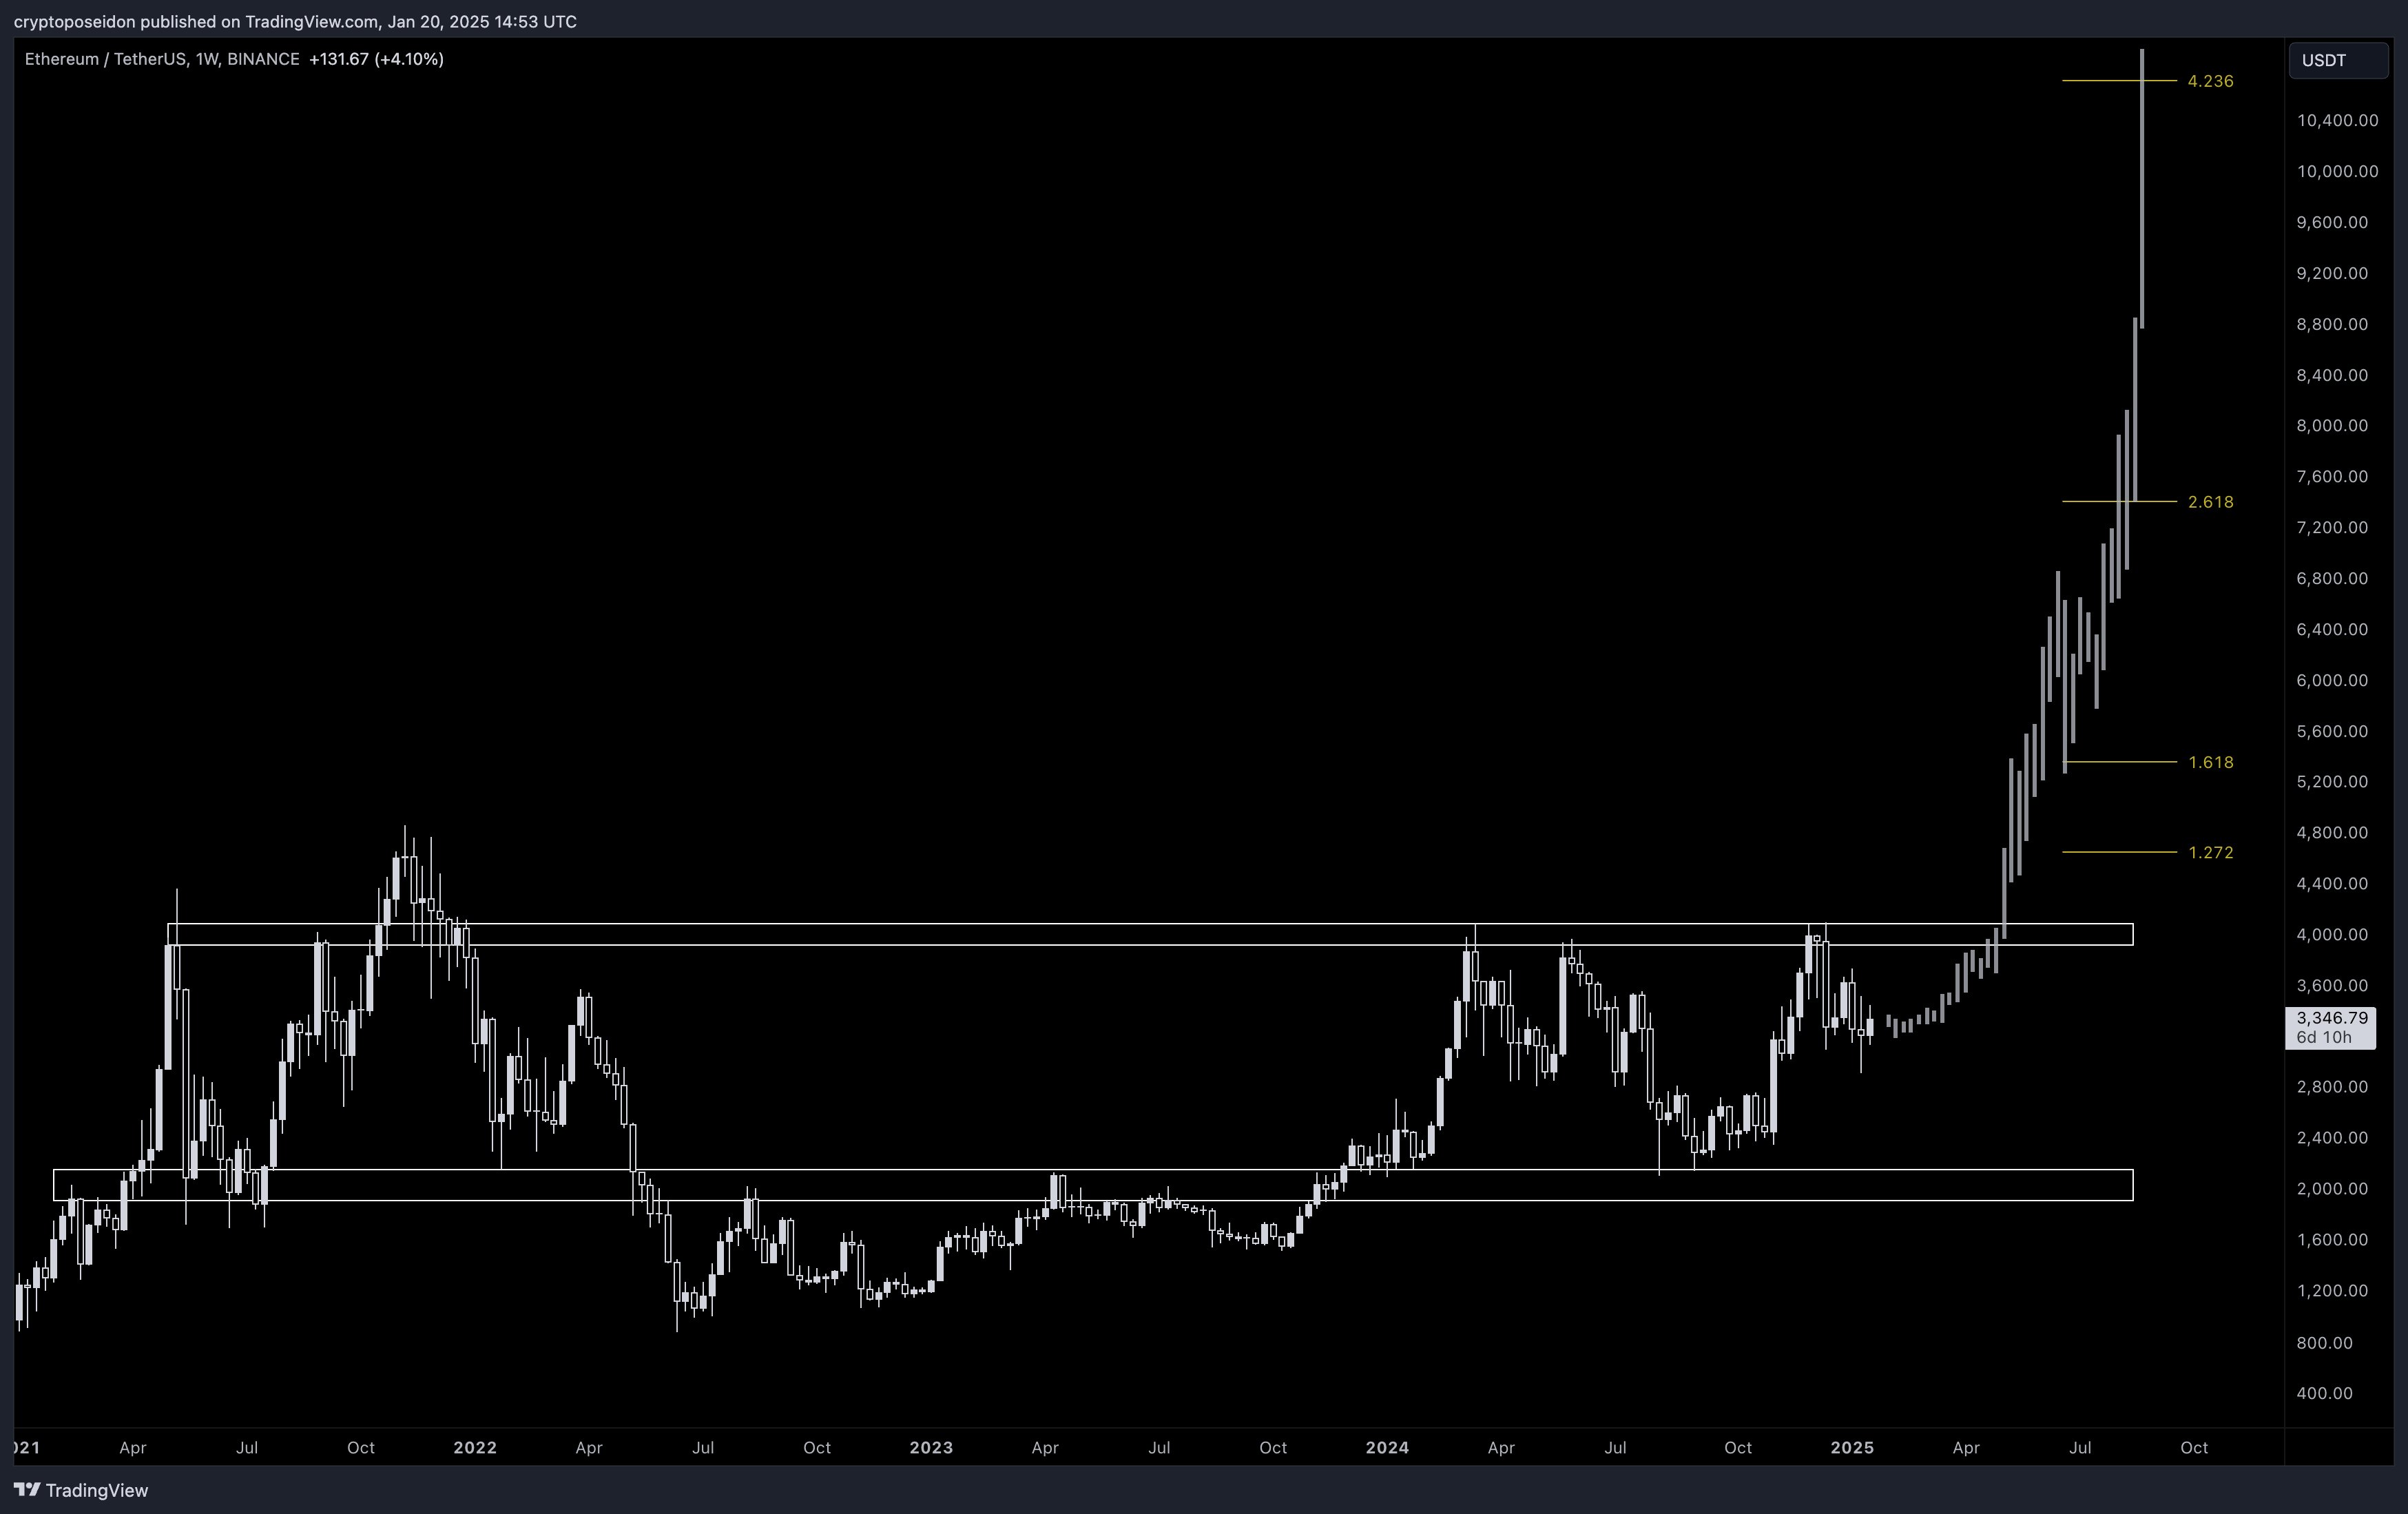
Finally, seasoned crypto market commentator Poseidon offered a more macro perspective on ETH’s price action. The analyst noted that Ethereum has been trading within a range for the past four years. A breakout above the critical $4,000 resistance level could propel ETH beyond $10,000, based on Fibonacci price extensions.
2025: The Year Of Altseason?
A full-blown altseason typically requires ETH to lead the market. Thus, a strong 2025 for Ethereum could significantly increase the likelihood of the eagerly anticipated altseason. Fortunately, many investors are optimistic about ETH’s prospects this year.
Related Reading
In December 2024, analysts at brokerage firm Bernstein remarked that ETH’s risk-reward ratio has become increasingly attractive. Similarly, Steno Research predicted that ETH could outperform BTC in Q1 2025, with a price target as high as $8,000.
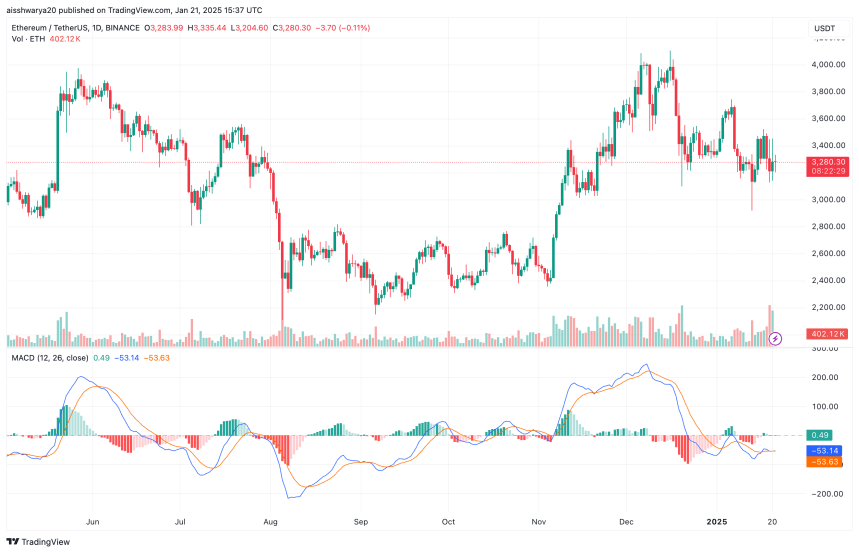
However, the $4,000 resistance level remains ETH’s Achilles’ heel. At the time of writing, ETH is trading at $3,280, down 2.1% in the past 24 hours.
Featured image from Unsplash, Charts from X and TradingView.com