
- Fibonacci retracement levels indicated areas of strong support and resistance, providing insights into future price movements.
- This declining MVRV ratio aligns with ETC’s price’s proximity to the 0.618 Fibonacci level, reinforcing the possibility of a rebound.
Ethereum Classic [ETC], a widely followed cryptocurrency, recently exhibited notable price movements, sparking interest among traders and analysts.
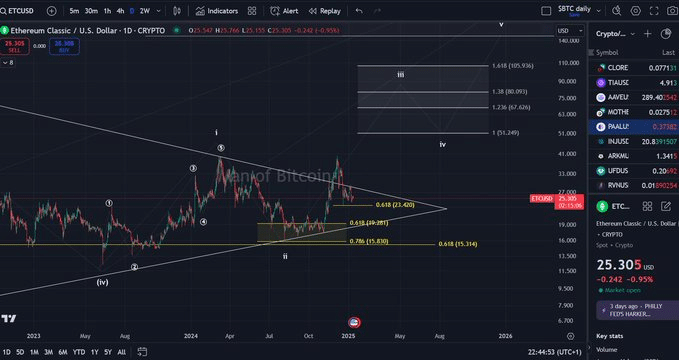
The daily chart reveals a descending triangle pattern, a structure often signaling potential breakout opportunities.
Additionally, critical Fibonacci retracement levels indicated areas of strong support and resistance, providing insights into future price movements.
Fibonacci retracement analysis
In the Fibonacci retracement levels, Ethereum Classic’s price recently hovered near the 0.618 retracement level at $23.46, a zone historically regarded as strong support.
This level often serves as a turning point, where bullish momentum may resume if buyers regain confidence.
Source: TradingView
However, a breakdown below this level could send ETC towards the next critical support at the 0.786 Fibonacci level, approximately $15.14. This deeper correction would likely reflect broader market weakness or external factors such as regulatory pressures.
On the upside, a breakout above the triangle’s upper trendline could allow ETC to target the wave iii projections, with $37 to $63 acting as potential resistance zones.
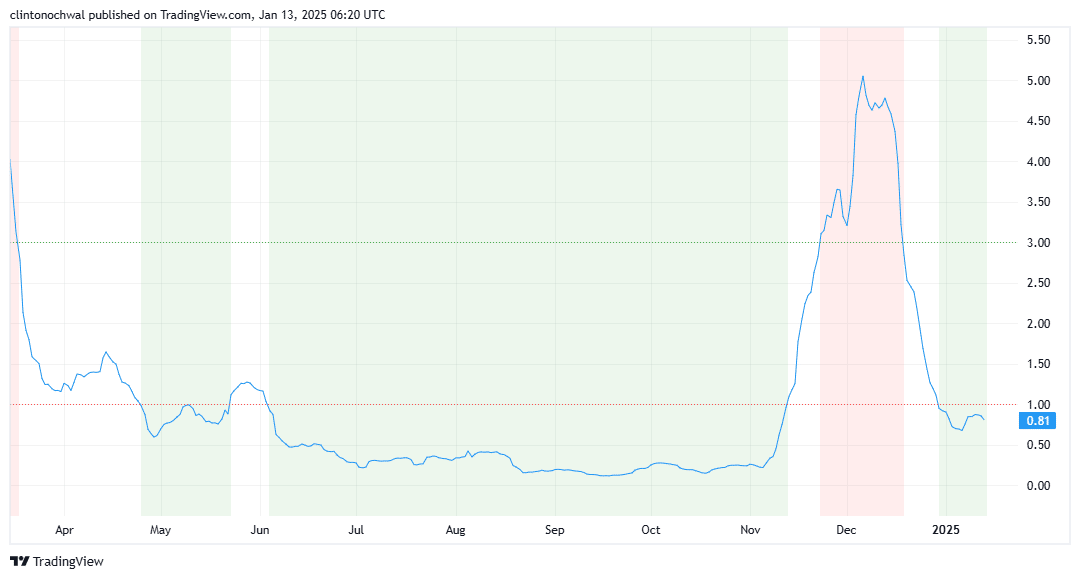
MVRV Ratio analysis
Currently, Ethereum Classic’s MVRV ratio suggests the asset is approaching undervaluation. Historically, when the MVRV ratio dips below 1, it indicates that most investors are holding ETC at a loss, which often precedes a price recovery.
Source:TradingView
The declining MVRV ratio aligns with ETC’s price nearing the 0.618 Fibonacci level, reinforcing the possibility of a rebound.
Long-term investors often view undervaluation signals as prime entry points. However, if the ratio continues to drop, it could indicate further price declines, potentially toward the $15.14 level.
Given the current market structure and historical trends, Ethereum Classic might consolidate near its current levels before attempting a recovery. A shift in market sentiment or broader altcoin momentum could accelerate a bullish move.
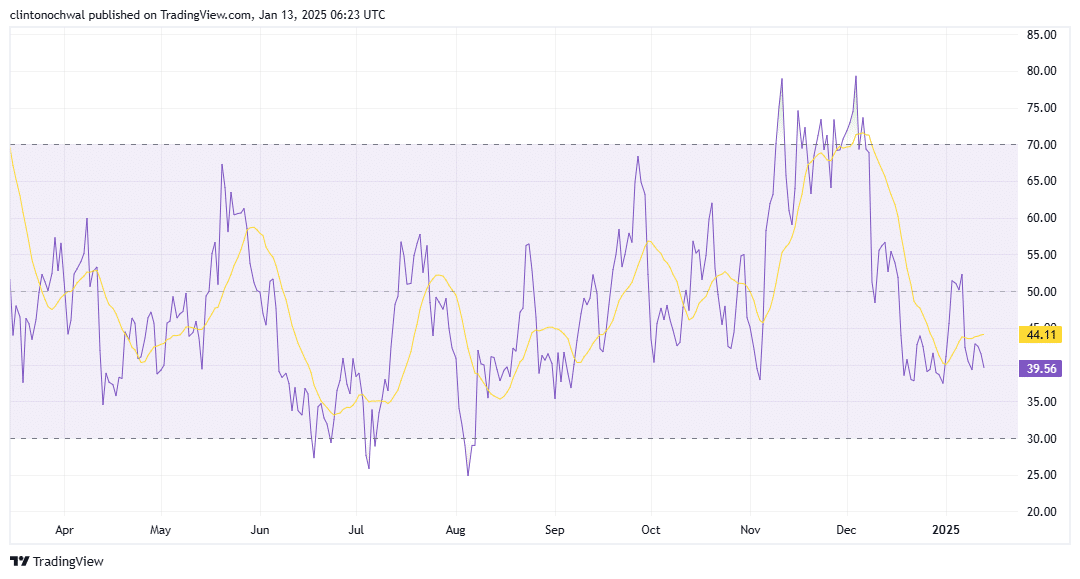
Relative Strength Index of ETC points to…
The Relative Strength Index (RSI) provides insights into ETC’s momentum and whether it is overbought or oversold.
On the daily timeframe, ETC’s RSI currently hovers in the 40-50 range, suggesting a neutral to slightly oversold condition. This aligns with the recent price dip and the testing of the 0.618 Fibonacci level.
Source:TradingView
If the RSI drops below 30, it would signal an oversold condition, which often coincides with reversal points in price action.
This scenario increases the likelihood of a rebound from $23.46 or even from the lower $15.14 level if the decline persists.
Conversely, a rise in RSI above 50 could signal renewed bullish momentum, complementing a potential breakout from the descending triangle pattern.
External factors impacting Ethereum Classic’s movement
While technical indicators provide valuable insights, external factors have also influenced ETC’s recent price action. The cryptocurrency market, heavily affected by Bitcoin’s dominance and macroeconomic conditions, has created a volatile environment for altcoins like Ethereum Classic.
Regulatory uncertainty, particularly in major markets like the U.S., has dampened investor confidence, causing many altcoins to face sell-offs.
Furthermore, Ethereum Classic’s relatively stagnant ecosystem development compared to competing networks has limited its appeal to institutional investors, exerting additional pressure on its price.
ETC often mirrors Bitcoin’s price trends, and Bitcoin’s inability to sustain momentum above key resistance levels has contributed to ETC’s lack of bullish follow-through.
However, renewed interest in Bitcoin or positive market developments could act as catalysts for ETC to break out of its descending triangle pattern.
Final thoughts
Ethereum Classic presents a mixed outlook for traders, balancing technical support levels, undervaluation signals, and momentum indicators against external challenges.
– Realistic or not, here’s ETC market cap in BTC’s terms
The 0.618 Fibonacci level at $23.46 remains a key area to watch, supported by a relatively neutral RSI and an MVRV ratio suggesting undervaluation.
Ethereum Classic’s ability to maintain current support levels and capitalize on potential market shifts could set the stage for a breakout. This makes it a cryptocurrency to watch for both short-term and long-term investors.