
Reason to trust
Strict editorial policy that focuses on accuracy, relevance, and impartiality
Created by industry experts and meticulously reviewed
The highest standards in reporting and publishing
Strict editorial policy that focuses on accuracy, relevance, and impartiality
Morbi pretium leo et nisl aliquam mollis. Quisque arcu lorem, ultricies quis pellentesque nec, ullamcorper eu odio.
Ethereum has finally broken through a key resistance level, trading above $1,900 after pushing past the long-standing $1,850 barrier. This move marks the beginning of a breakout many hoped for—but few expected to arrive so soon. After weeks of hesitation, bearish pressure, and uncertain momentum, ETH is showing renewed strength just as broader market sentiment begins to shift.
Related Reading
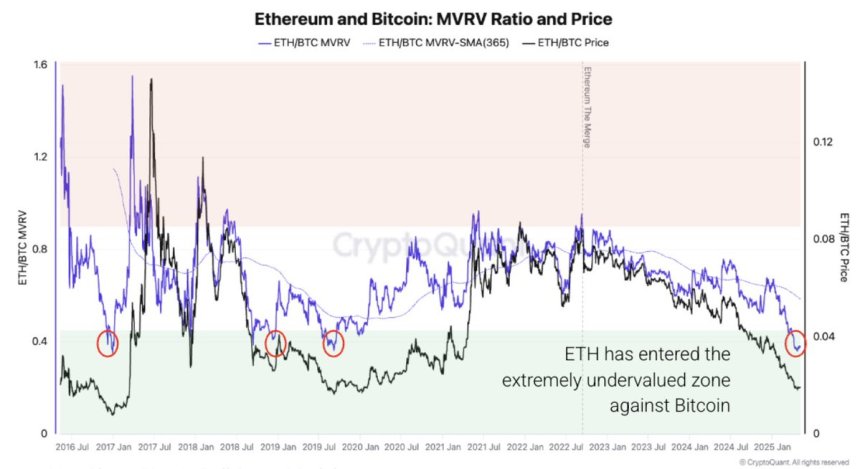
Adding weight to the breakout, new insights from CryptoQuant reveal that Ethereum is now extremely undervalued compared to Bitcoin, the first time this has occurred since 2019. Historically, such levels of ETH/BTC undervaluation have preceded periods of strong Ethereum outperformance. While price action is leading the way, on-chain data is reinforcing the bullish case, signaling that ETH may be entering a favorable phase in its cycle.
This renewed upside comes amid low expectations and broad skepticism, making it all the more impactful. As ETH trades above $1,900, traders and investors are watching closely for follow-through and potential continuation toward $2,000 and beyond. If history is any guide, Ethereum’s recent move may not just be a short-term spike—it could be the beginning of a larger trend reversal, especially as the ETH/BTC valuation gap begins to close.
Ethereum Flirts With $2,000 As Undervaluation Sparks Bullish Hopes
Ethereum is now approaching the critical $2,000 mark, a level that, if reclaimed and held, would confirm a technical breakout and potentially usher in a broader bullish phase. After weeks of sluggish movement and bearish pressure, ETH is gaining momentum and showing signs of strength across both price action and on-chain metrics. A close above $2,000 would mark a major shift in sentiment, signaling renewed confidence among investors and traders alike.
However, risks remain. Ongoing tensions between the US and China continue to inject uncertainty into global markets, and the US Federal Reserve has shown no sign of pivoting. With interest rates expected to remain elevated and quantitative tightening (QT) still in effect, the macroeconomic backdrop remains a headwind. Should these geopolitical and monetary factors ease, Ethereum’s breakout could gain sustained traction.
According to CryptoQuant, the Ethereum-to-Bitcoin MVRV (Market Value to Realized Value) ratio highlights that ETH is now extremely undervalued compared to BTC—the first time this has occurred since 2019. Historically, such conditions have led to strong periods of Ethereum outperformance.
Still, the bullish setup faces some internal friction. Supply pressure, weak on-chain demand, and flat network activity could stall momentum if market sentiment doesn’t improve further. While Ethereum’s current push is encouraging, confirmation will only come with sustained movement above resistance and stronger fundamentals. Until then, ETH remains at a critical juncture, with the potential to lead the next leg of the crypto rally—or slip back into consolidation if external and internal pressures persist.
Related Reading
ETH Price Analysis: Technical Details
Ethereum is trading at $1,933 after a strong breakout above the $1,900 resistance zone, marking its highest level since early April. On the 4-hour chart, ETH surged from around $1,850 with increased volume, breaking a multi-week consolidation range. This move confirms bullish momentum and puts the $2,000 psychological level clearly in sight.
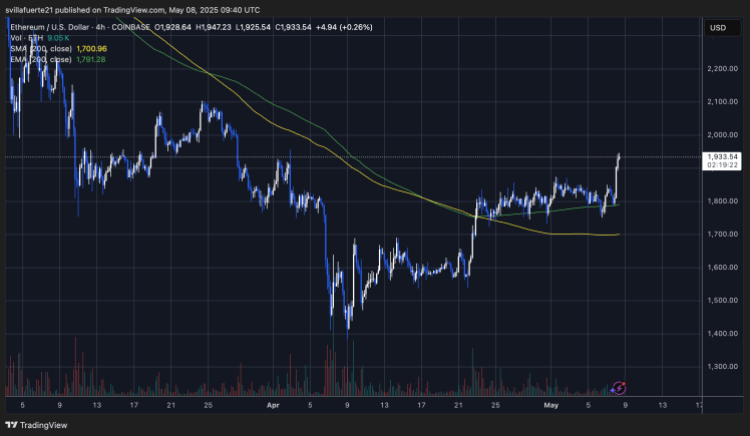
The breakout is further supported by the price now trending well above both the 200-period EMA ($1,791) and the 200-period SMA ($1,700). These long-term moving averages had previously acted as resistance but have now been flipped into potential dynamic support. The strength of this rally indicates renewed buying interest and a potential shift in market sentiment.
However, the next challenge lies in maintaining this upward momentum. Ethereum must hold above the $1,900–$1,920 level to avoid a fakeout and confirm this breakout as sustainable. A clean push through $2,000 would further validate the bullish structure and open the door to higher targets.
Related Reading
Overall, the chart reflects a decisive technical breakout, backed by volume and structure. If bulls remain in control and macro conditions remain steady, ETH could be preparing for a stronger trend continuation in the days ahead.
Featured image from Dall-E, chart from TradingView