
As Ethereum (ETH) continues to trade in the mid-$2,000 range, signs are emerging that the second-largest cryptocurrency by market cap may be getting ready for its next leg up. The digital asset appears poised to break out of a bull flag formation, with $3,300 as a potential target.
Ethereum Looks Poised For A Breakout
According to a recent CryptoQuant Quicktake post by contributor ibrahimcosar, the daily ETH chart indicates a breakout from a bull flag formation. The analyst shared the following chart to illustrate ETH’s next possible move.
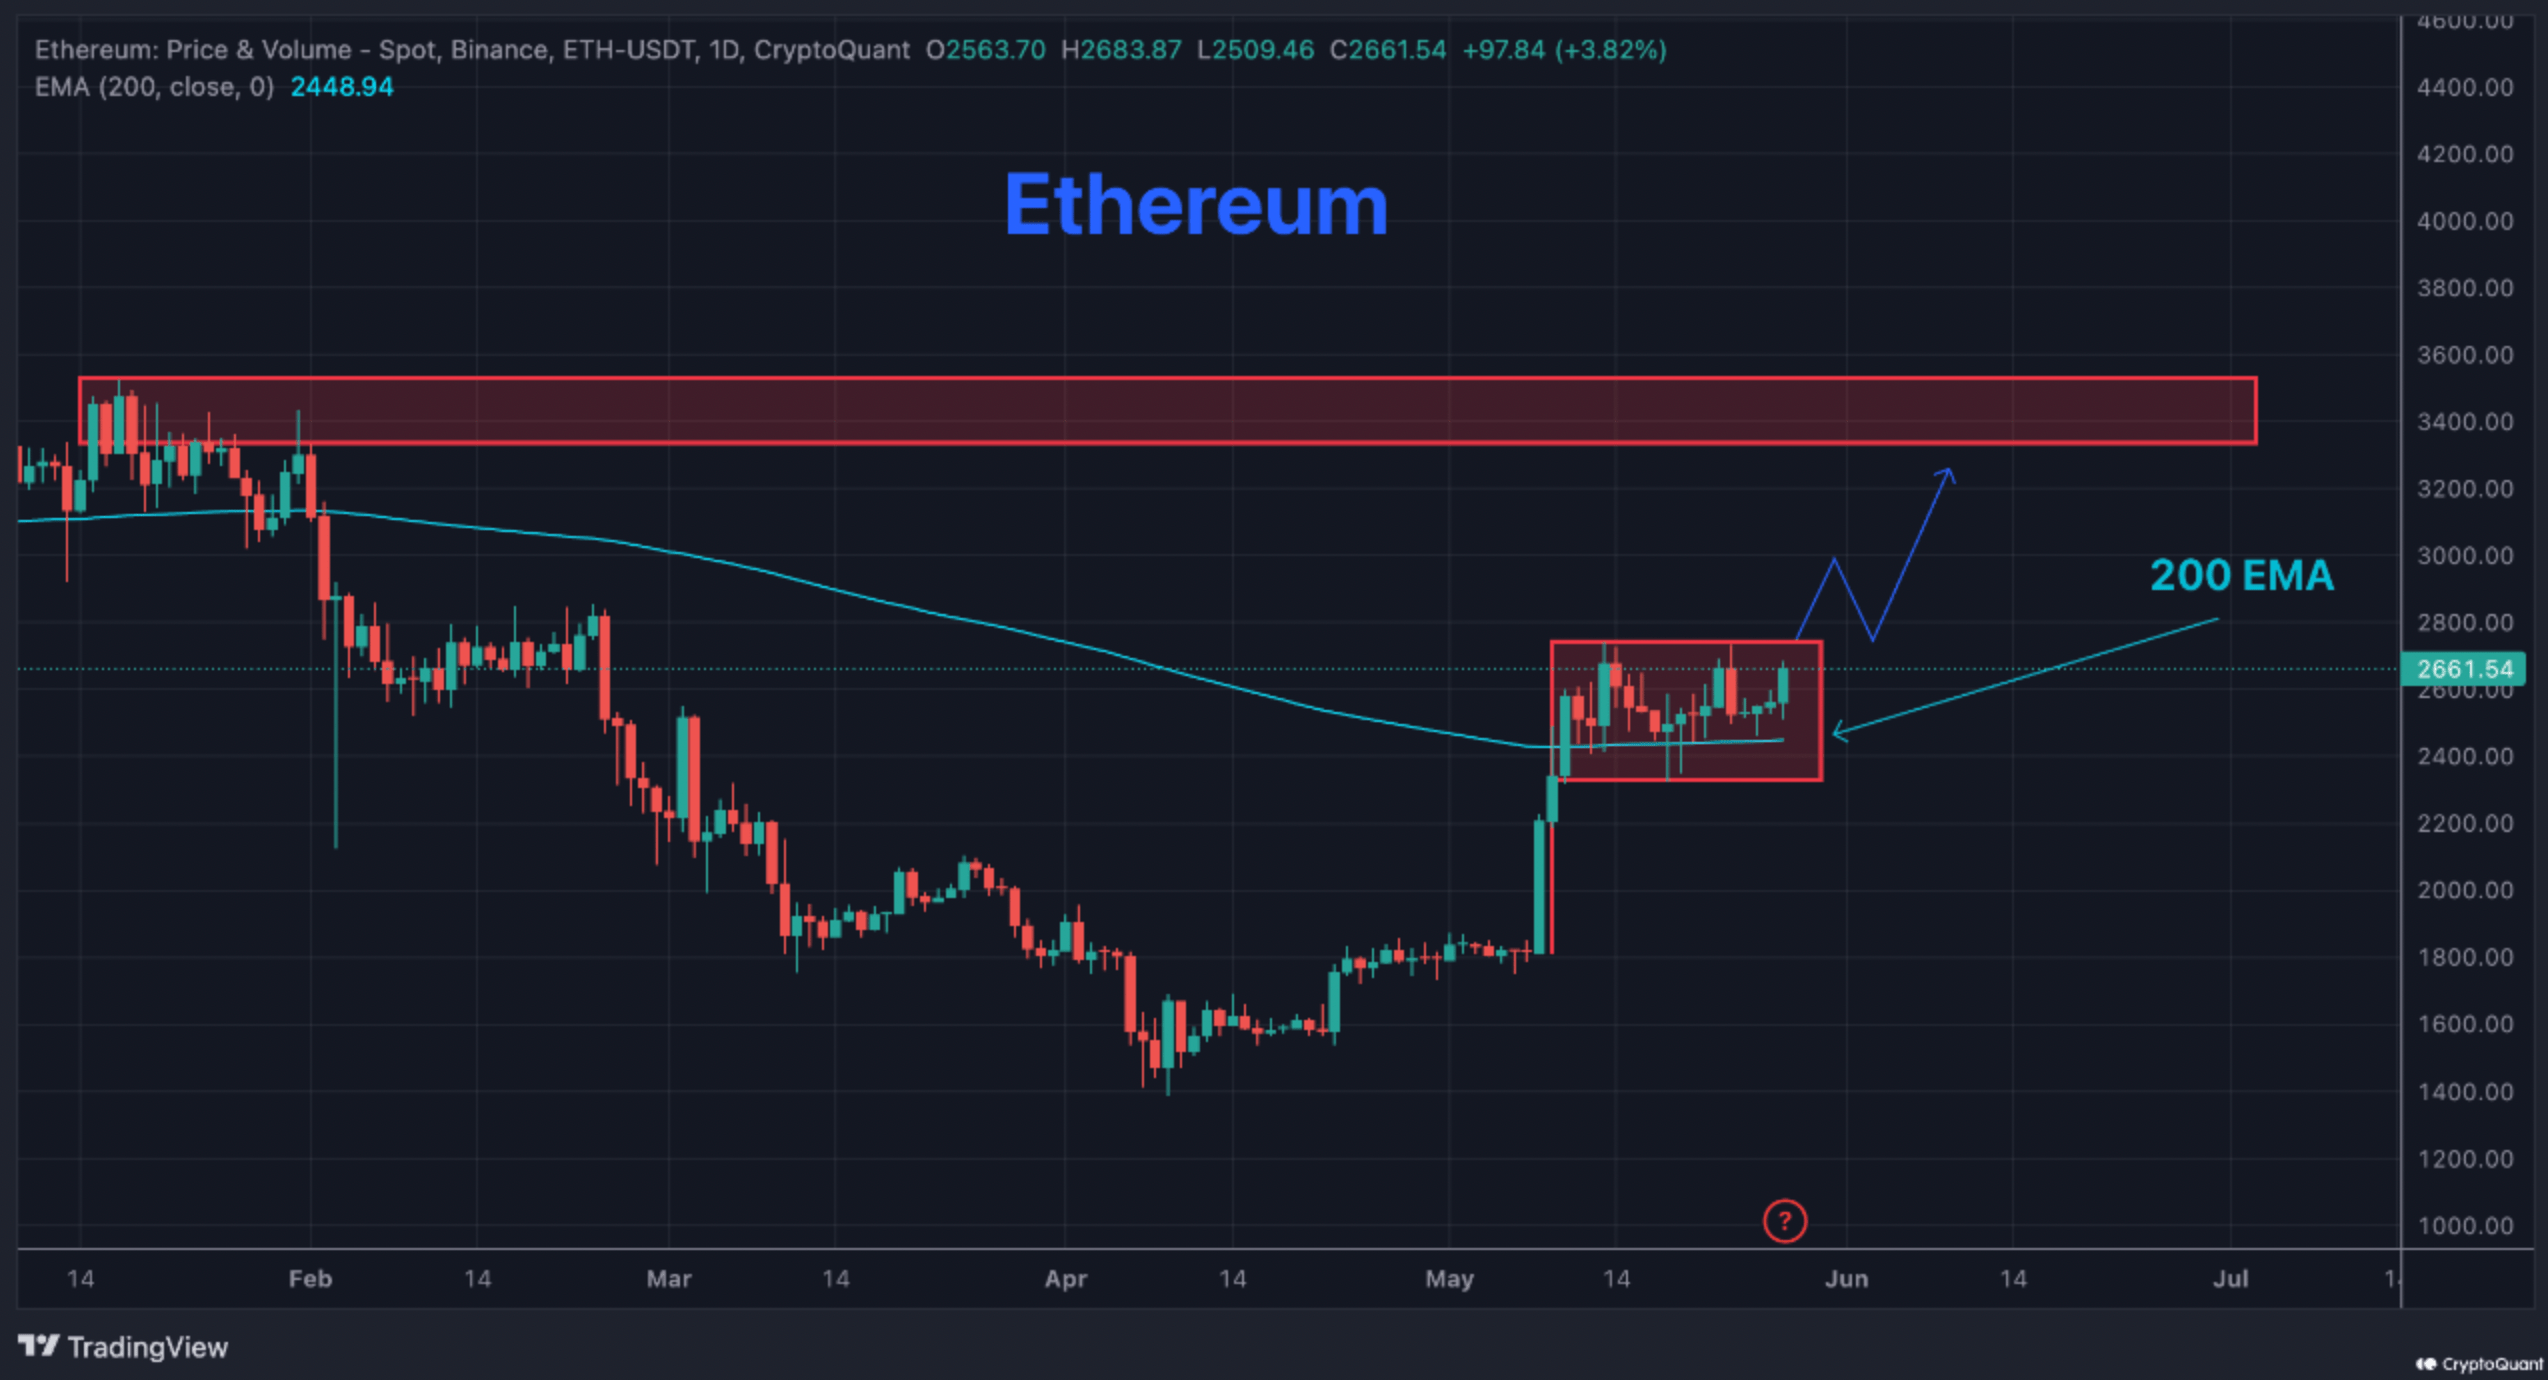
For the uninitiated, A bull flag pattern is a bullish continuation pattern that forms after a strong upward price movement – the flagpole – followed by a period of consolidation within parallel lines – the flag. It typically signals that the asset may break out upward and continue its prior uptrend.
Notably, ETH has been consolidating between $2,400 and $2,700 for the past 17 days. This consolidation – combined with the prior upward momentum – has formed a classic bull flag pattern on the daily chart.
In addition, ETH has remained above the 200-day Exponential Moving Average (EMA) during this same period. The analyst emphasized the bullish implications of this technical signal, stating:
Staying above the 200-day EMA is a bullish signal, and it’s highly likely that in the next strong move, we could see ETH in the $3000–$3500 range. This is the kind of clear bullish signal we’ve seen before major rallies in the past.
Further, ibrahimcosar noted that Ethereum’s movement often serves as a bellwether for the altcoin market. Historically, when ETH rallies, other altcoins tend to follow suit. A breakout in ETH could thus trigger broader gains across the crypto market.
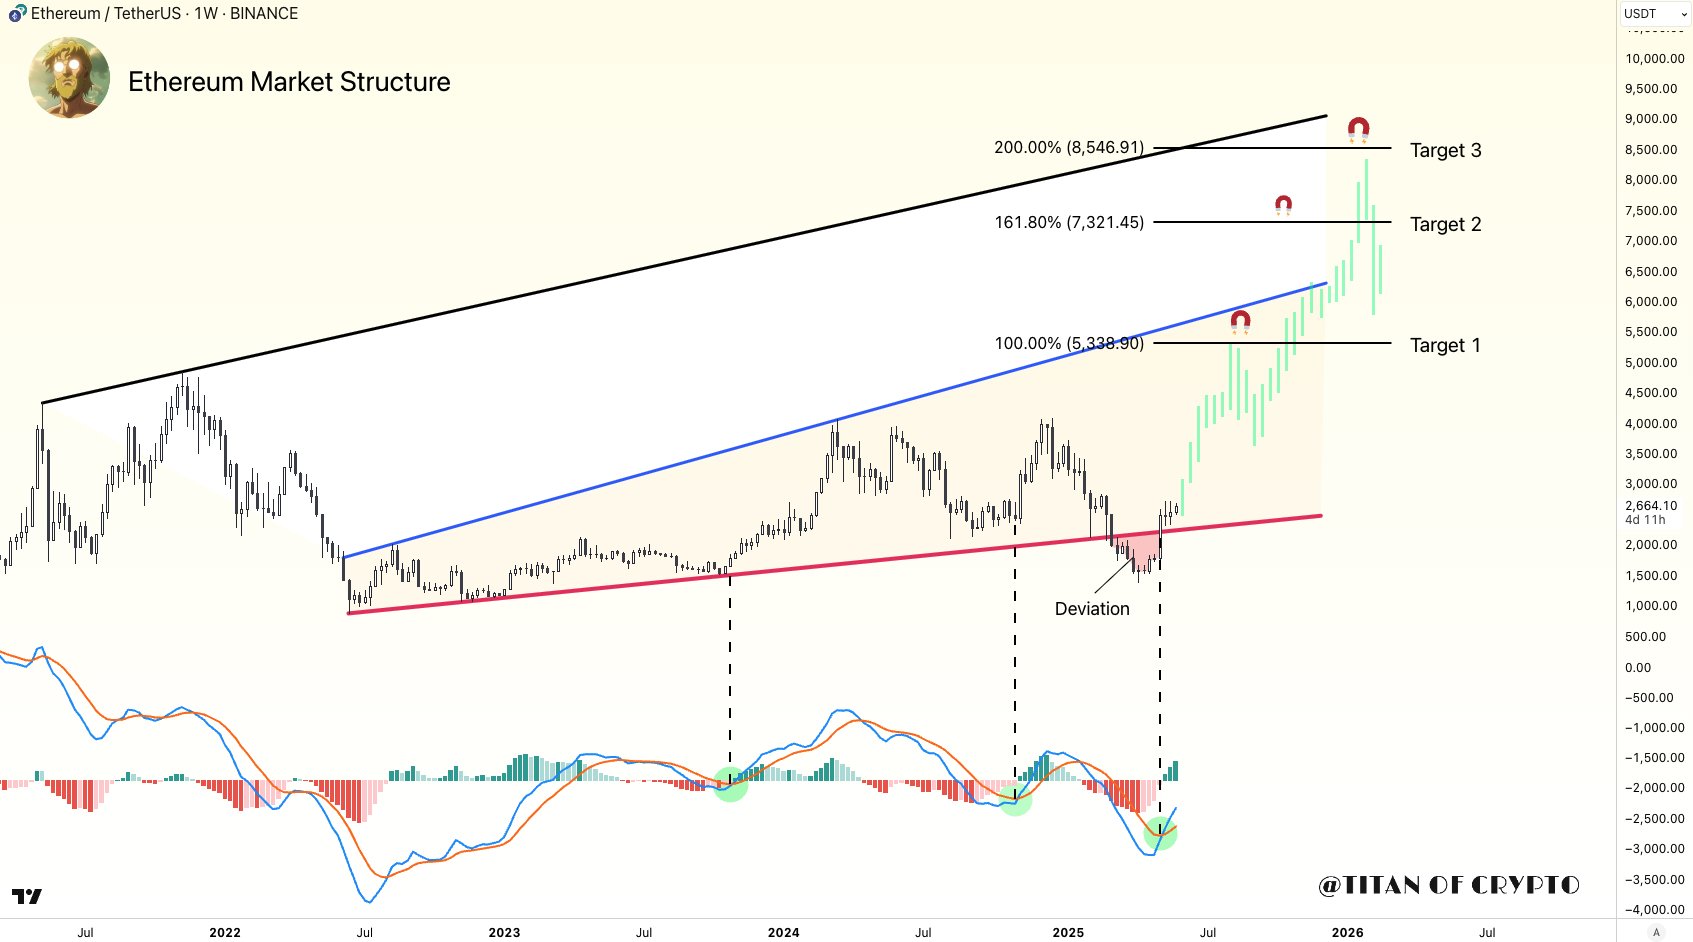
Meanwhile, noted crypto analyst Titan of Crypto shared the following weekly chart illustrating potential ETH price targets if it sustains its current bullish trajectory. The chart shows ETH hitting as high as $8,500 by the beginning of 2026.
What Are ETH Whales Anticipating?
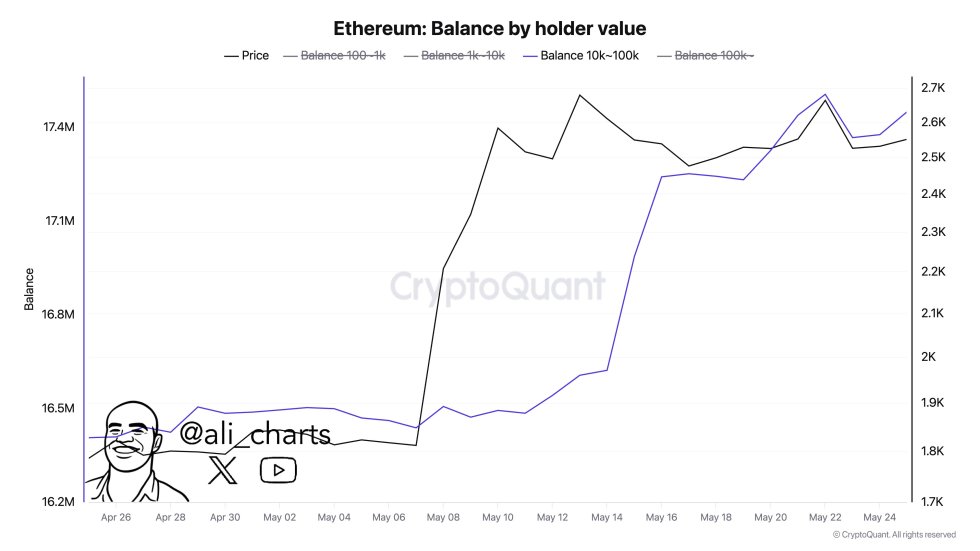
In a separate post on X, crypto analyst Ali Martinez observed that Ethereum whales – wallets holding 10,000 to 100,000 ETH – have accumulated over 1 million ETH in the past month.
Similarly, Web3 growth manager Cas Abbe recently remarked that ETH is starting to show signs of life once again. The executive predicted that ETH may reach $4,000 by Q3 2025.
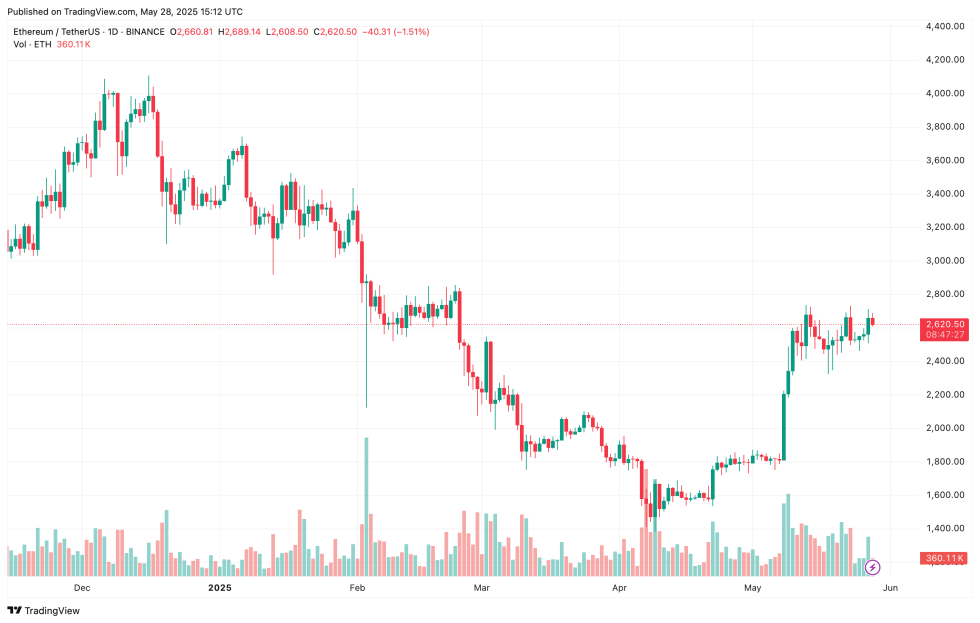
That said, hurdles remain. Blockchain analytics firm Glassnode recently stated that once ETH reaches $2,800, it may witness strong selling pressure which can derail its bullish momentum. At press time, ETH trades at $2,620, down 1% in the past 24 hours.
Featured image created with Unsplash, charts from CryptoQuant, X, and TradingView.com

Editorial Process for bitcoinist is centered on delivering thoroughly researched, accurate, and unbiased content. We uphold strict sourcing standards, and each page undergoes diligent review by our team of top technology experts and seasoned editors. This process ensures the integrity, relevance, and value of our content for our readers.