
On March 4, Ethereum’s native token, Ether (ETH), dropped to a new yearly low of $1,996, marking the altcoin’s lowest value since November 2023. In that 24-hour period, roughly $100 million in Ethereum positions were liquidated, with ETH futures open interest (OI) declining 10.31% across all exchanges.
Ethereum 1-day chart. Source: Cointelegraph/TradingView
Is Ether price at a generational entry or lost cause?
The second largest cryptocurrency is drawing mixed opinions from the crypto industry. Ethereum’s Pectra upgrade was deployed on the Sepolia testnet on March 5, and Gabriel Halm, a research analyst at IntoTheBlock, believed it could potentially ease ETH’s recent selling pressure. Earlier this week, Halm said,
“While Ethereum’s upcoming Pectra upgrade won’t necessarily trigger an instant price bump, it marks a significant step forward in the ongoing improvements to the Ethereum ecosystem.”
Likewise, Louie, a crypto analyst, drew a similarity between Ethereum’s current bearish predicament and Bitcoin in 2023. The analyst implied that both assets display similar price structures, market sentiment and catalysts, which may eventually allow ETH to “rhyme” BTC’s bullish breakout from 2023.
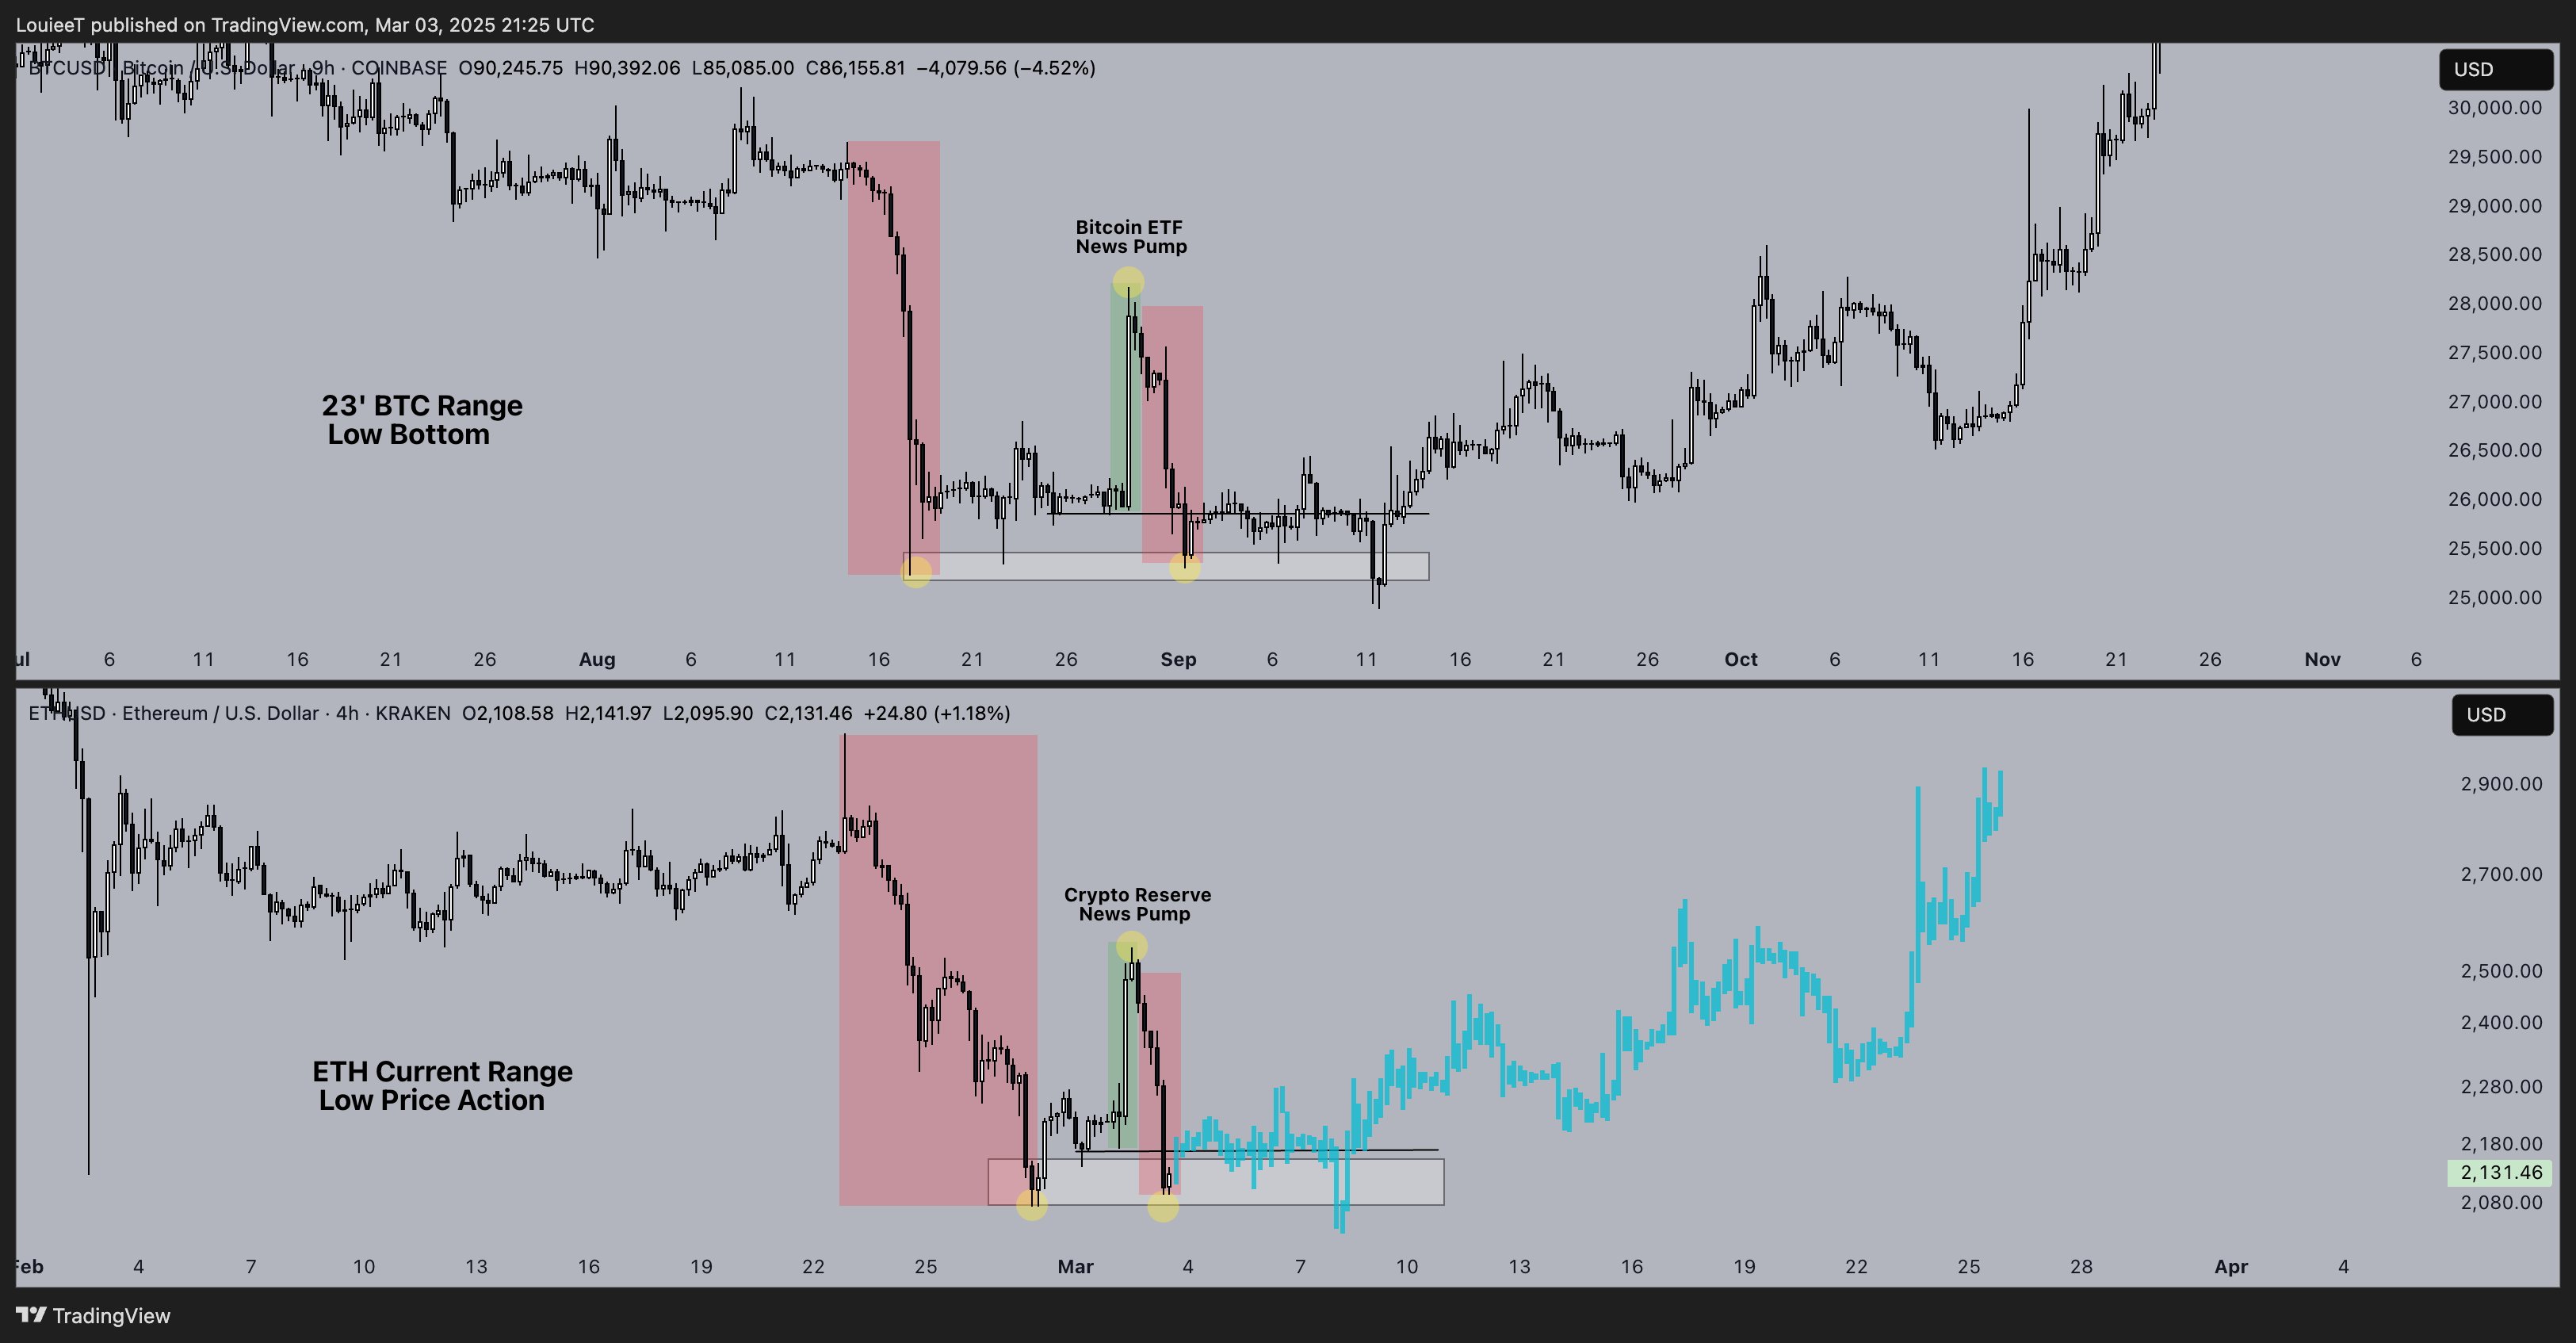
Ethereum vs Bitcoin comparison chart. Source: X.com
On the contrary, Matthew Hyland, a market analyst, said that Ethereum is possibly already in a bear market. With Ethereum objectively in a 357-day downtrend, Hyland believed no correlation existed between BTC and ETH in the current market. The analyst said,
“Up until a year ago everything was in a bull together and a bear together, now its mixed.”
Additionally, the analyst mentioned that ETH’s price bottom will potentially outline the beginning of the next cycle.
Meanwhile, the confirmed double top pattern on the weekly and monthly charts increases the probability of a deeper correction for the altcoin.
Nebraskangooner, a crypto commentator, told his 379,900 followers that based on the pattern, the measured breakdown target is around $1,200, another 42% below ETH’s current price.
Related: Why is the crypto market down today?
Only 26% of Ethereum addresses are profitable
Between Dec. 1, 2024, and March 4, 2025, Ethereum price declined 50% in just 78 days. While such drastic corrections are common with low-cap crypto assets, ETH has lost more than $250 billion in market cap during that period.
This sharp, bearish turnaround has undoubtedly affected investors as well, with data from IntoTheBlock suggesting that only 26% of all addresses holding 36.92 million ETH are in profit. A staggering 70% of addresses are “out of the money,” with only 4.46% of addresses at breakeven value.
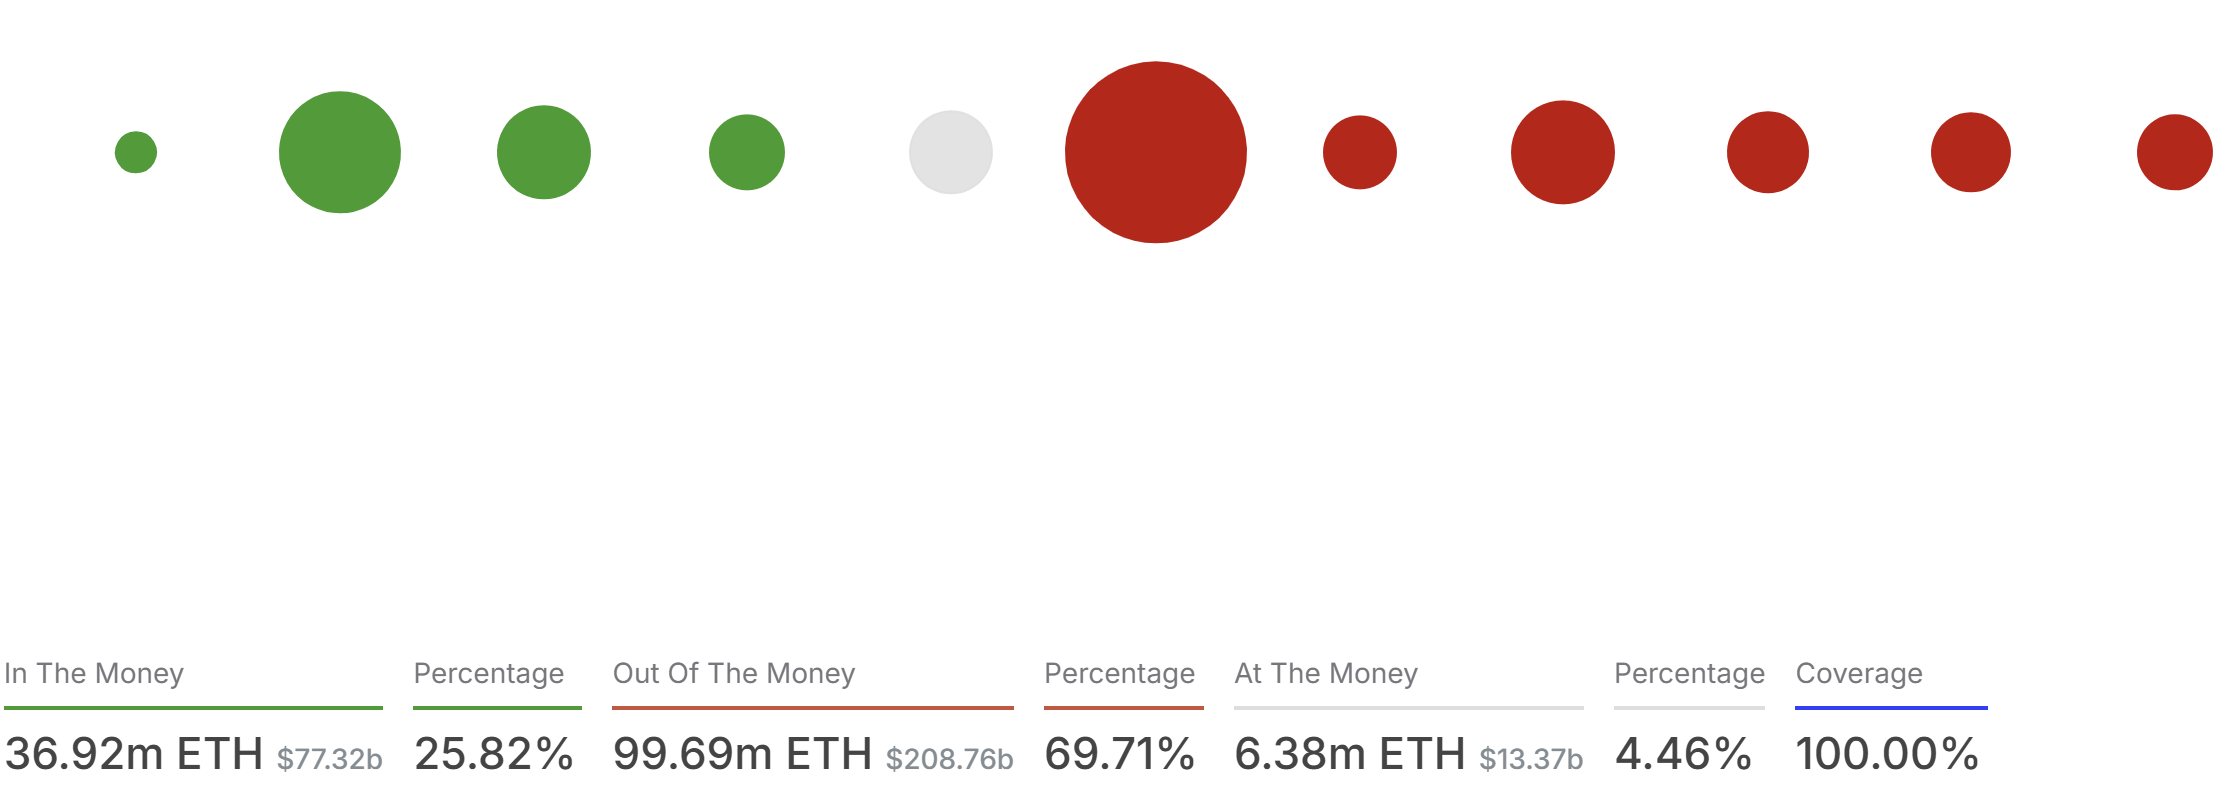
Active addresses by profitability. Source: IntoTheBlock
From a technical perspective as well, Ethereum’s weekly close has taken place under a 980-day uptrend, dating back to previous cycle lows in June 2022. A break below the ascending trendline indicates a long-term trend reversal, which might be a warning sign for the bulls.
However, the altcoin recovered sharply over the past 24 hours, jumping 12% from recent lows at $1,996 to upward of $2,242.
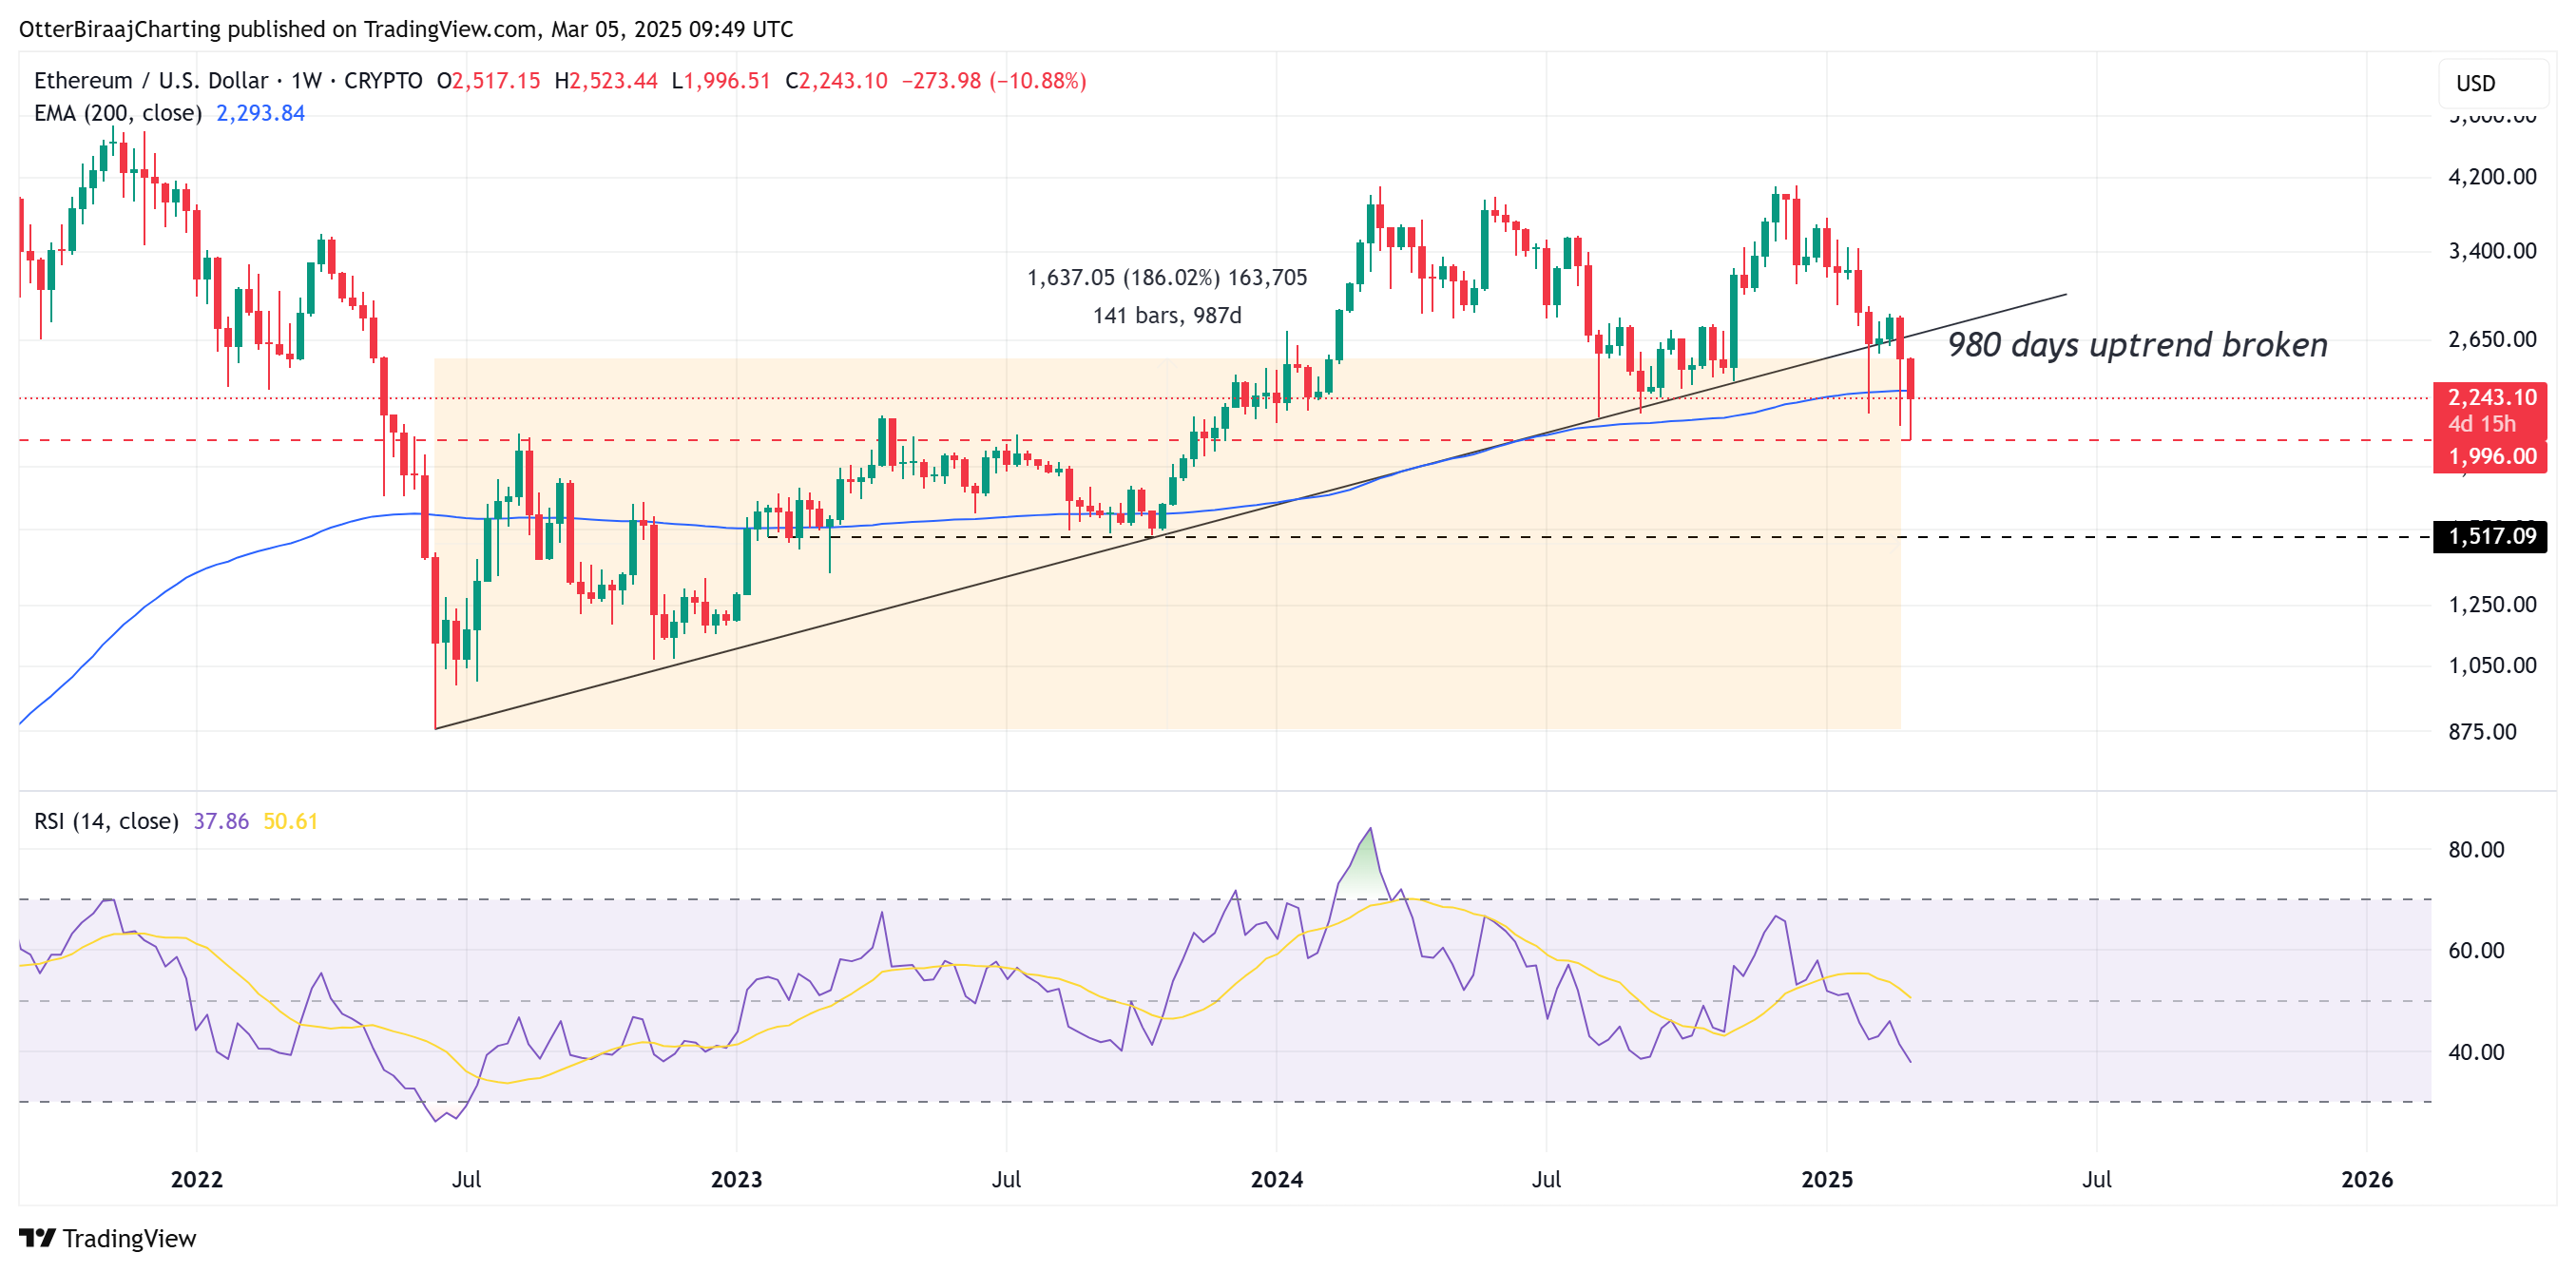
Ethereum 1-week chart. Source: Cointelegraph/TradingView
The relative strength index (RSI) has also dropped to multi-year lows, which further confirms the bearish nature of Ethereum’s long-term market structure. Yet, it could potentially imply weakness in selling pressure as well in the short-term, leading to relief rallies.
Related: Bitcoin sags toward $80K as US dollar strength bounces off 12-week low
This article does not contain investment advice or recommendations. Every investment and trading move involves risk, and readers should conduct their own research when making a decision.