
Reason to trust
Strict editorial policy that focuses on accuracy, relevance, and impartiality
Created by industry experts and meticulously reviewed
The highest standards in reporting and publishing
Strict editorial policy that focuses on accuracy, relevance, and impartiality
Morbi pretium leo et nisl aliquam mollis. Quisque arcu lorem, ultricies quis pellentesque nec, ullamcorper eu odio.
Crypto analyst Trend Diva has provided an in-depth analysis of the current Ethereum price action. She revealed that ETH is still moving inside an ascending triangle but warned that it could suffer further downside pressure if it fails to stay above a crucial support level.
Ethereum Price Still Inside An Ascending Triangle Despite Recent Crash
In a TradingView post, Trend Diva revealed that the Ethereum price is moving inside a clear ascending triangle. The upper boundary acts as long-term resistance, and the lower boundary provides dynamic support. This analysis comes amid ETH’s recent decline below $2,000.
Related Reading
The analyst noted that after a steady climb, the Ethereum price started showing weakness, confirmed by a head and shoulders pattern, which she claimed is a common sign that the trend might reverse. This weakness led to a strong drop for ETH, bringing its price down to the key support zone around $2,000.
Trend Diva stated that this support area is important for the Ethereum price because it meets with a major trendline, making it a likely spot where buyers could step in. She added that the volume profile also shows a lot of activity in this zone, meaning traders have been interested in these levels before.
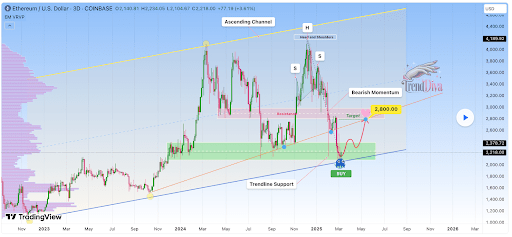
The analyst further remarked that if the Ethereum price holds above this $2,000 support, it could bounce towards the $2,800 level, which represents a previous resistance. However, she revealed that a breakdown below the trendline shifts the bias bearish towards $1,414.
For now, as long as ETH stays above $2,000, a rebound to $2,800 is still on the horizon.
It is worth mentioning that the Ethereum price briefly lost the $2,000 support level following a crypto market crash on Sunday. As such, there is also the possibility that it could drop to as low as $1,414 as Trend Diva warned.
A Drop To As Low As $1,250 Is Also On The Cards
In an X post, crypto analyst Ali Martinez said the Ethereum price seems to be breaking out of a parallel channel. He added that ETH could drop to as low as $1,250 if momentum sustains. ETH whales look to be doing everything possible to defend the $2,000 support zone and prevent Ethereum from dropping to these new lows.
Related Reading
Martinez revealed that the largest whales on the network have bought 330,000 ETH in the last 48 hours. This massive whale accumulation could help prevent further downside pressure and possibly spark a bullish reversal for the Ethereum price.
At the time of writing, the Ethereum price is trading at around $2,065, down over 5% in the last 24 hours, according to data from CoinMarketCap.
Featured image from iStock, chart from Tradingview.com