
On-chain data shows the Ethereum network has seen a sharp uptick in weekly whale volume, a sign that big-money interest is back in the asset.
Ethereum Large Transactions Volume Has Hit Highest Since 2021
In a new post on X, institutional DeFi solutions provider Sentora (formerly IntoTheBlock) has talked about the latest trend in the Large Transactions Volume of Ethereum.
The “Large Transactions Volume” here refers to an indicator that keeps track of the total amount of volume that’s being moved on the ETH network by transactions valued at more than $100,000.
Generally, only the whale-sized investors are capable of shifting amounts of this scale with a single transfer, so the volume associated with these moves can be assumed to be a representation of the activity being done by big-money investors.
When the value of the metric rises, it means the whales are increasing their transaction activity. Such a trend can be a sign that their interest in the asset is going up. On the other hand, the indicator going down implies the large holders may be losing interest in the cryptocurrency.
Now, here is a chart that shows the trend in the Ethereum Large Transactions Volume over the history of the coin:
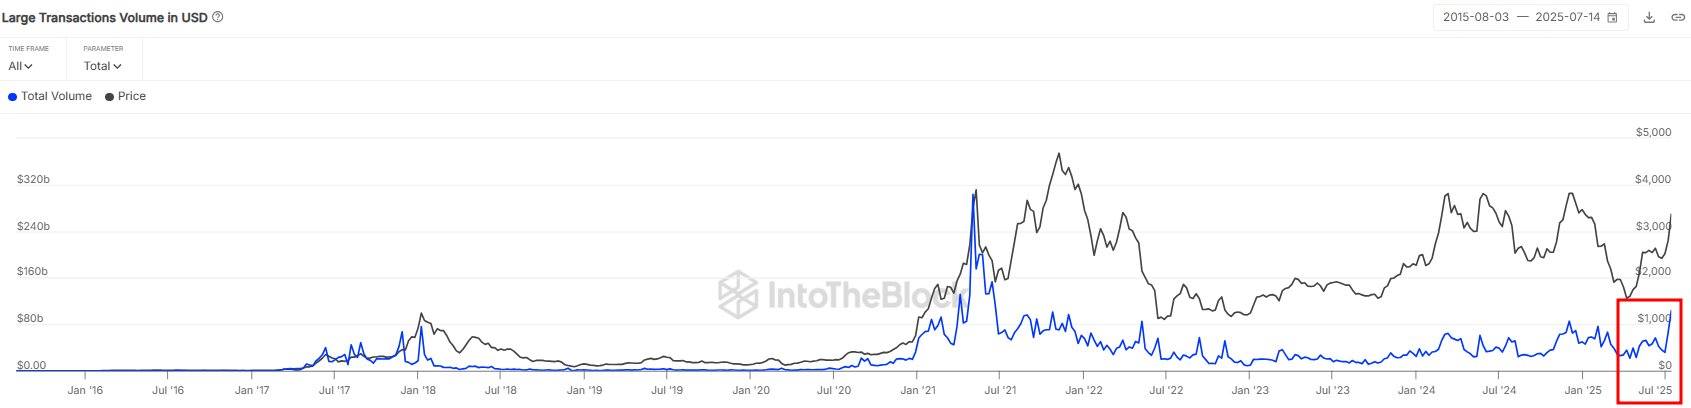
The value of the metric appears to have been rising in recent days | Source: Sentora on X
As displayed in the above graph, the Ethereum Large Transactions Volume has observed some rapid growth recently, suggesting the whales have significantly upped their transaction activity.
Last week, the metric’s value totaled to more than $100 billion, which is the highest weekly level since the 2021 bull run. This latest wave of activity from the whales has come alongside ETH’s breakout that has now brought its price into the high $3,000 levels.
While this is certainly a sign of elevated interest from the humongous entities, it’s hard to say whether it’s a positive. The Large Transactions Volume contains no information about the split between buying and selling moves, so its spike says nothing about which behavior is more dominant, just that these holders are making some sort of moves.
In some other news, the US Ethereum spot exchange-traded funds (ETFs) have just seen a record-breaking week, as analytics firm Glassnode has pointed out in an X post.
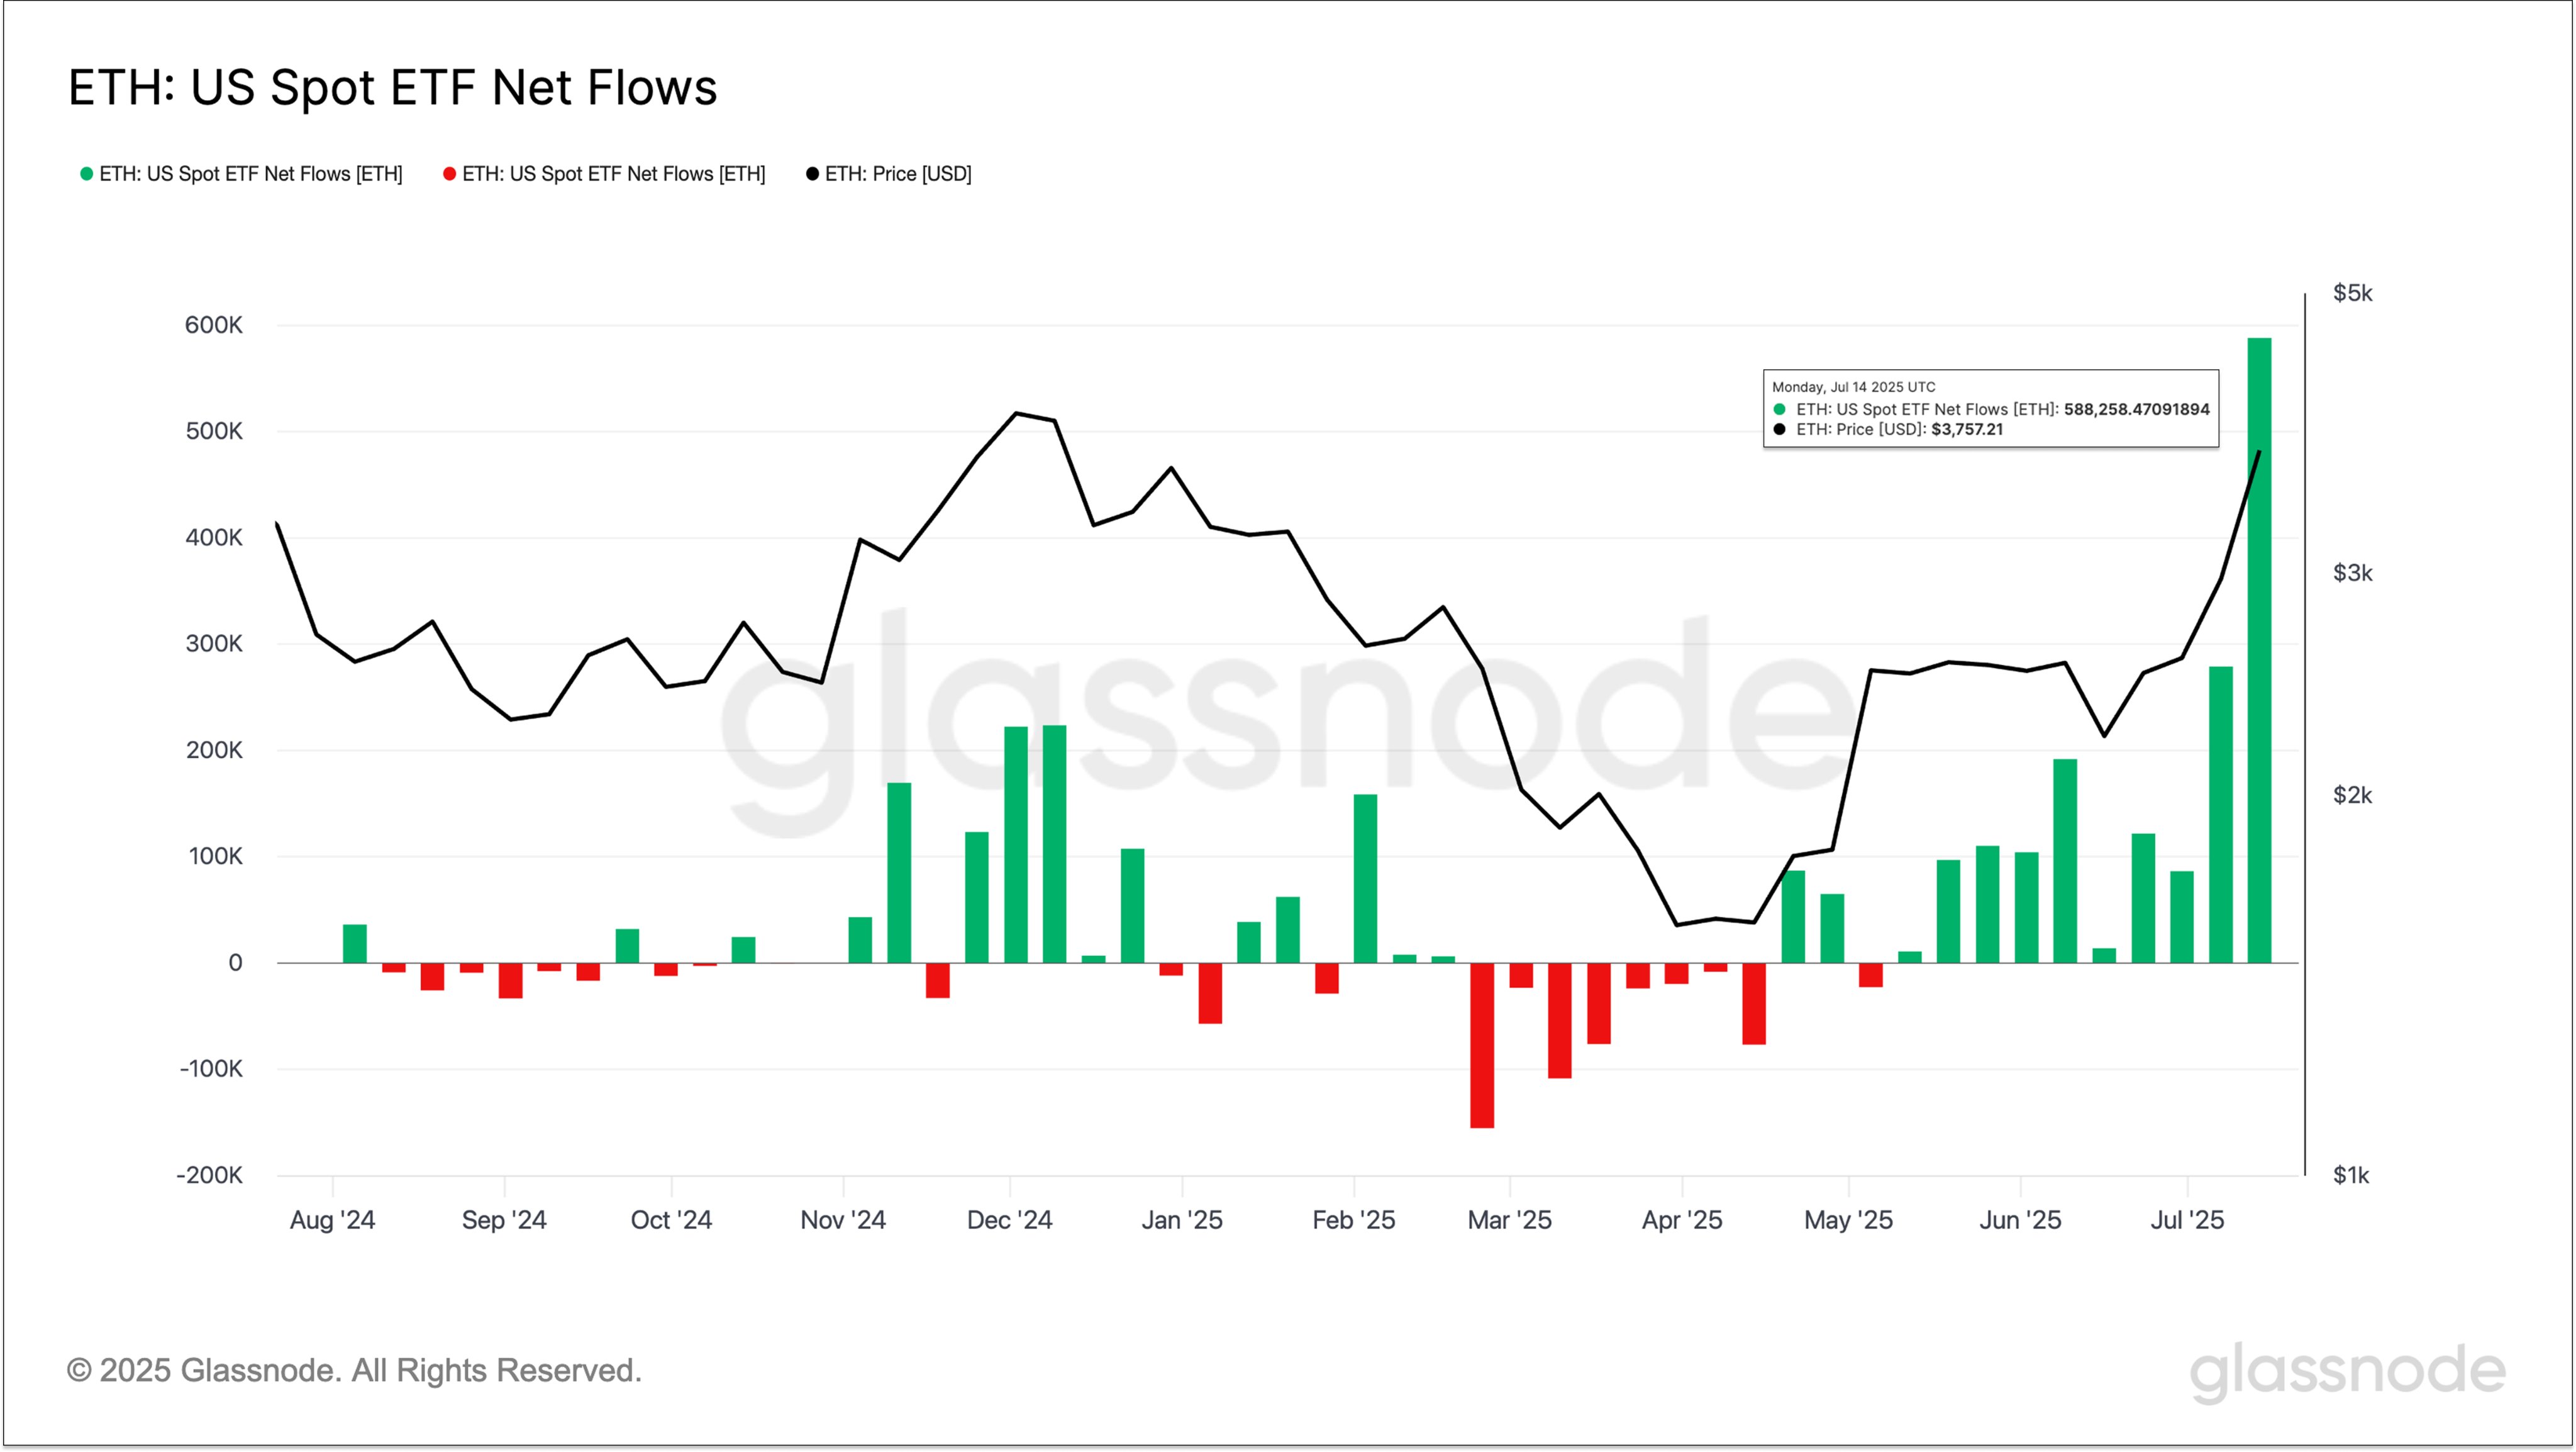
The trend in the netflow associated with the US ETH spot ETFs | Source: Glassnode on X
From the chart, it’s visible that the Ethereum spot ETFs have been seeing green weeks for a while now, but the latest one stands out for the sheer scale of inflows witnessed during it.
“Last week, Ethereum spot ETFs saw inflows of over 588K ETH – nearly 17x the historical average and more than double the previous record,” notes Glassnode.
ETH Price
At the time of writing, Ethereum is trading around $3,730, up 2% over the last week.
Looks like the price of the coin has been climbing up recently | Source: ETHUSDT on TradingView
Featured image from Dall-E, Glassnode.com, IntoTheBlock.com, chart from TradingView.com

Editorial Process for bitcoinist is centered on delivering thoroughly researched, accurate, and unbiased content. We uphold strict sourcing standards, and each page undergoes diligent review by our team of top technology experts and seasoned editors. This process ensures the integrity, relevance, and value of our content for our readers.