
- Ethereum’s supply on centralized exchanges has dropped to its lowest levels since 2016.
- On-chain data and derivatives trends indicate strong accumulation, but price consolidation continues.
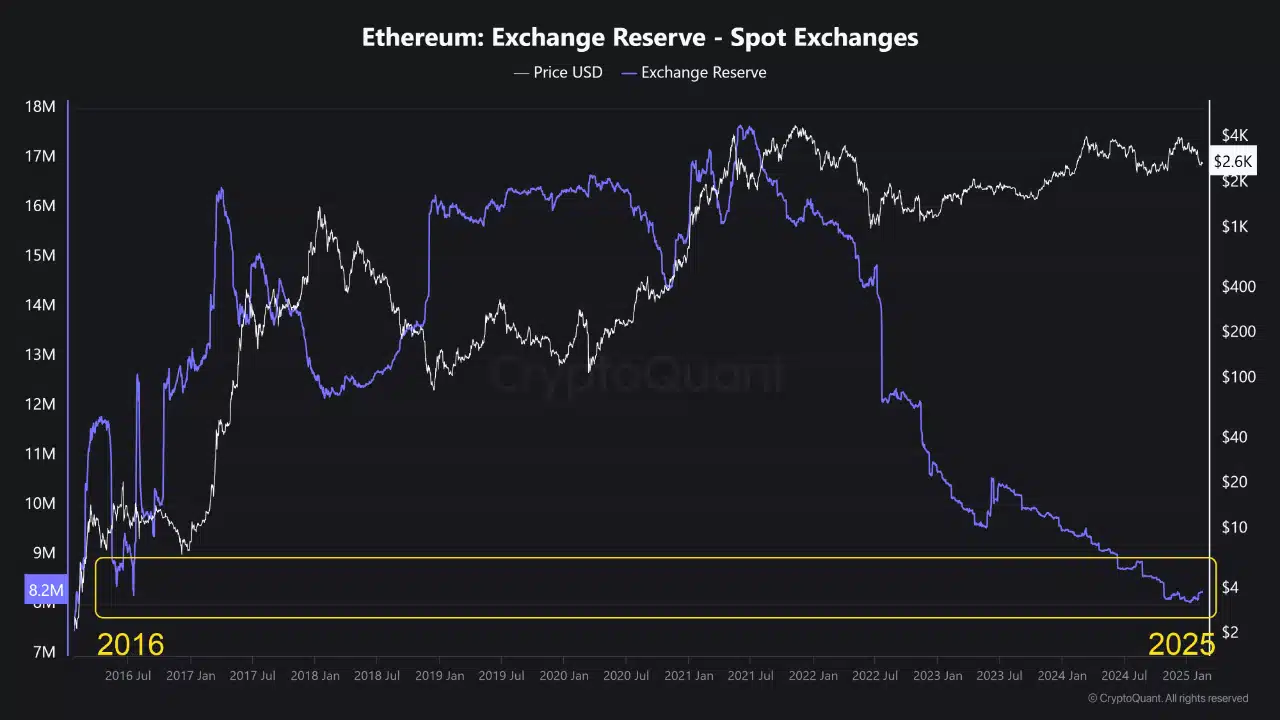
Ethereum’s [ETH] supply on centralized exchanges has plummeted to levels not seen since 2016, sparking intense speculation within the community.
Historically, such supply crunches have paved the way for significant price rallies, as reduced liquidity often curtails selling pressure.
As Ethereum’s staking ecosystem expands and anticipation around potential spot ETFs gains momentum, investors are curious.
Is ETH gearing up for another explosive breakout, or are market participants misinterpreting signals in this complex landscape?
Historical context
Ethereum’s price surges often coincide with periods of low exchange supply. During the 2016–2017 bull cycle, ETH’s supply on centralized exchanges dwindled as early adopters accumulated the asset. This propelled its price from under $10 to over $1,400 by early 2018.
A similar trend emerged during the 2020–2021 DeFi boom when investors migrated ETH to decentralized finance platforms. This drove its price to an all-time high of $4,800.
More recently, Ethereum’s post-Merge transition (2022–2023) introduced a deflationary mechanism. Staking locked up significant amounts of ETH in validator nodes, further reducing liquid supply.
While historical patterns show that low exchange supply can signal strong price rallies, macroeconomic conditions and investor sentiment remain critical factors in determining the next breakout.
Spot and derivatives data supporting ETH’s momentum
Ethereum’s spot market reflects a significant outflow from centralized exchanges, reaching levels not seen since 2016, as shown in CryptoQuant data.
This trend highlights growing investor preference for self-custody and staking, suggesting long-term confidence in ETH’s value proposition.
Concurrently, derivatives data from Coinglass reveals rising open interest in ETH futures, indicating heightened market participation.
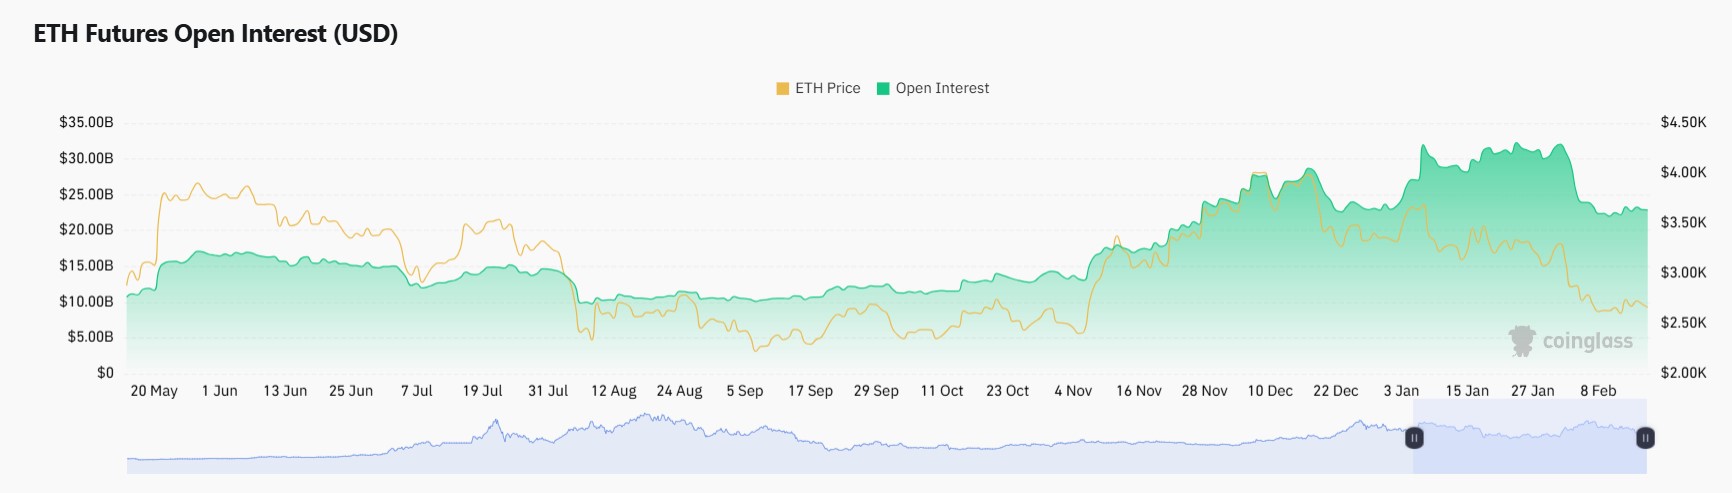
Source: Coinglass
This surge could reflect bullish sentiment, with traders positioning for an upward move, or a cautious hedging strategy amid market uncertainty.
Funding Rates and perpetual swaps further signal market expectations of price appreciation. Together, these spot and derivatives trends create a compelling case for Ethereum’s potential breakout.
Ethereum: Signs of accumulation?
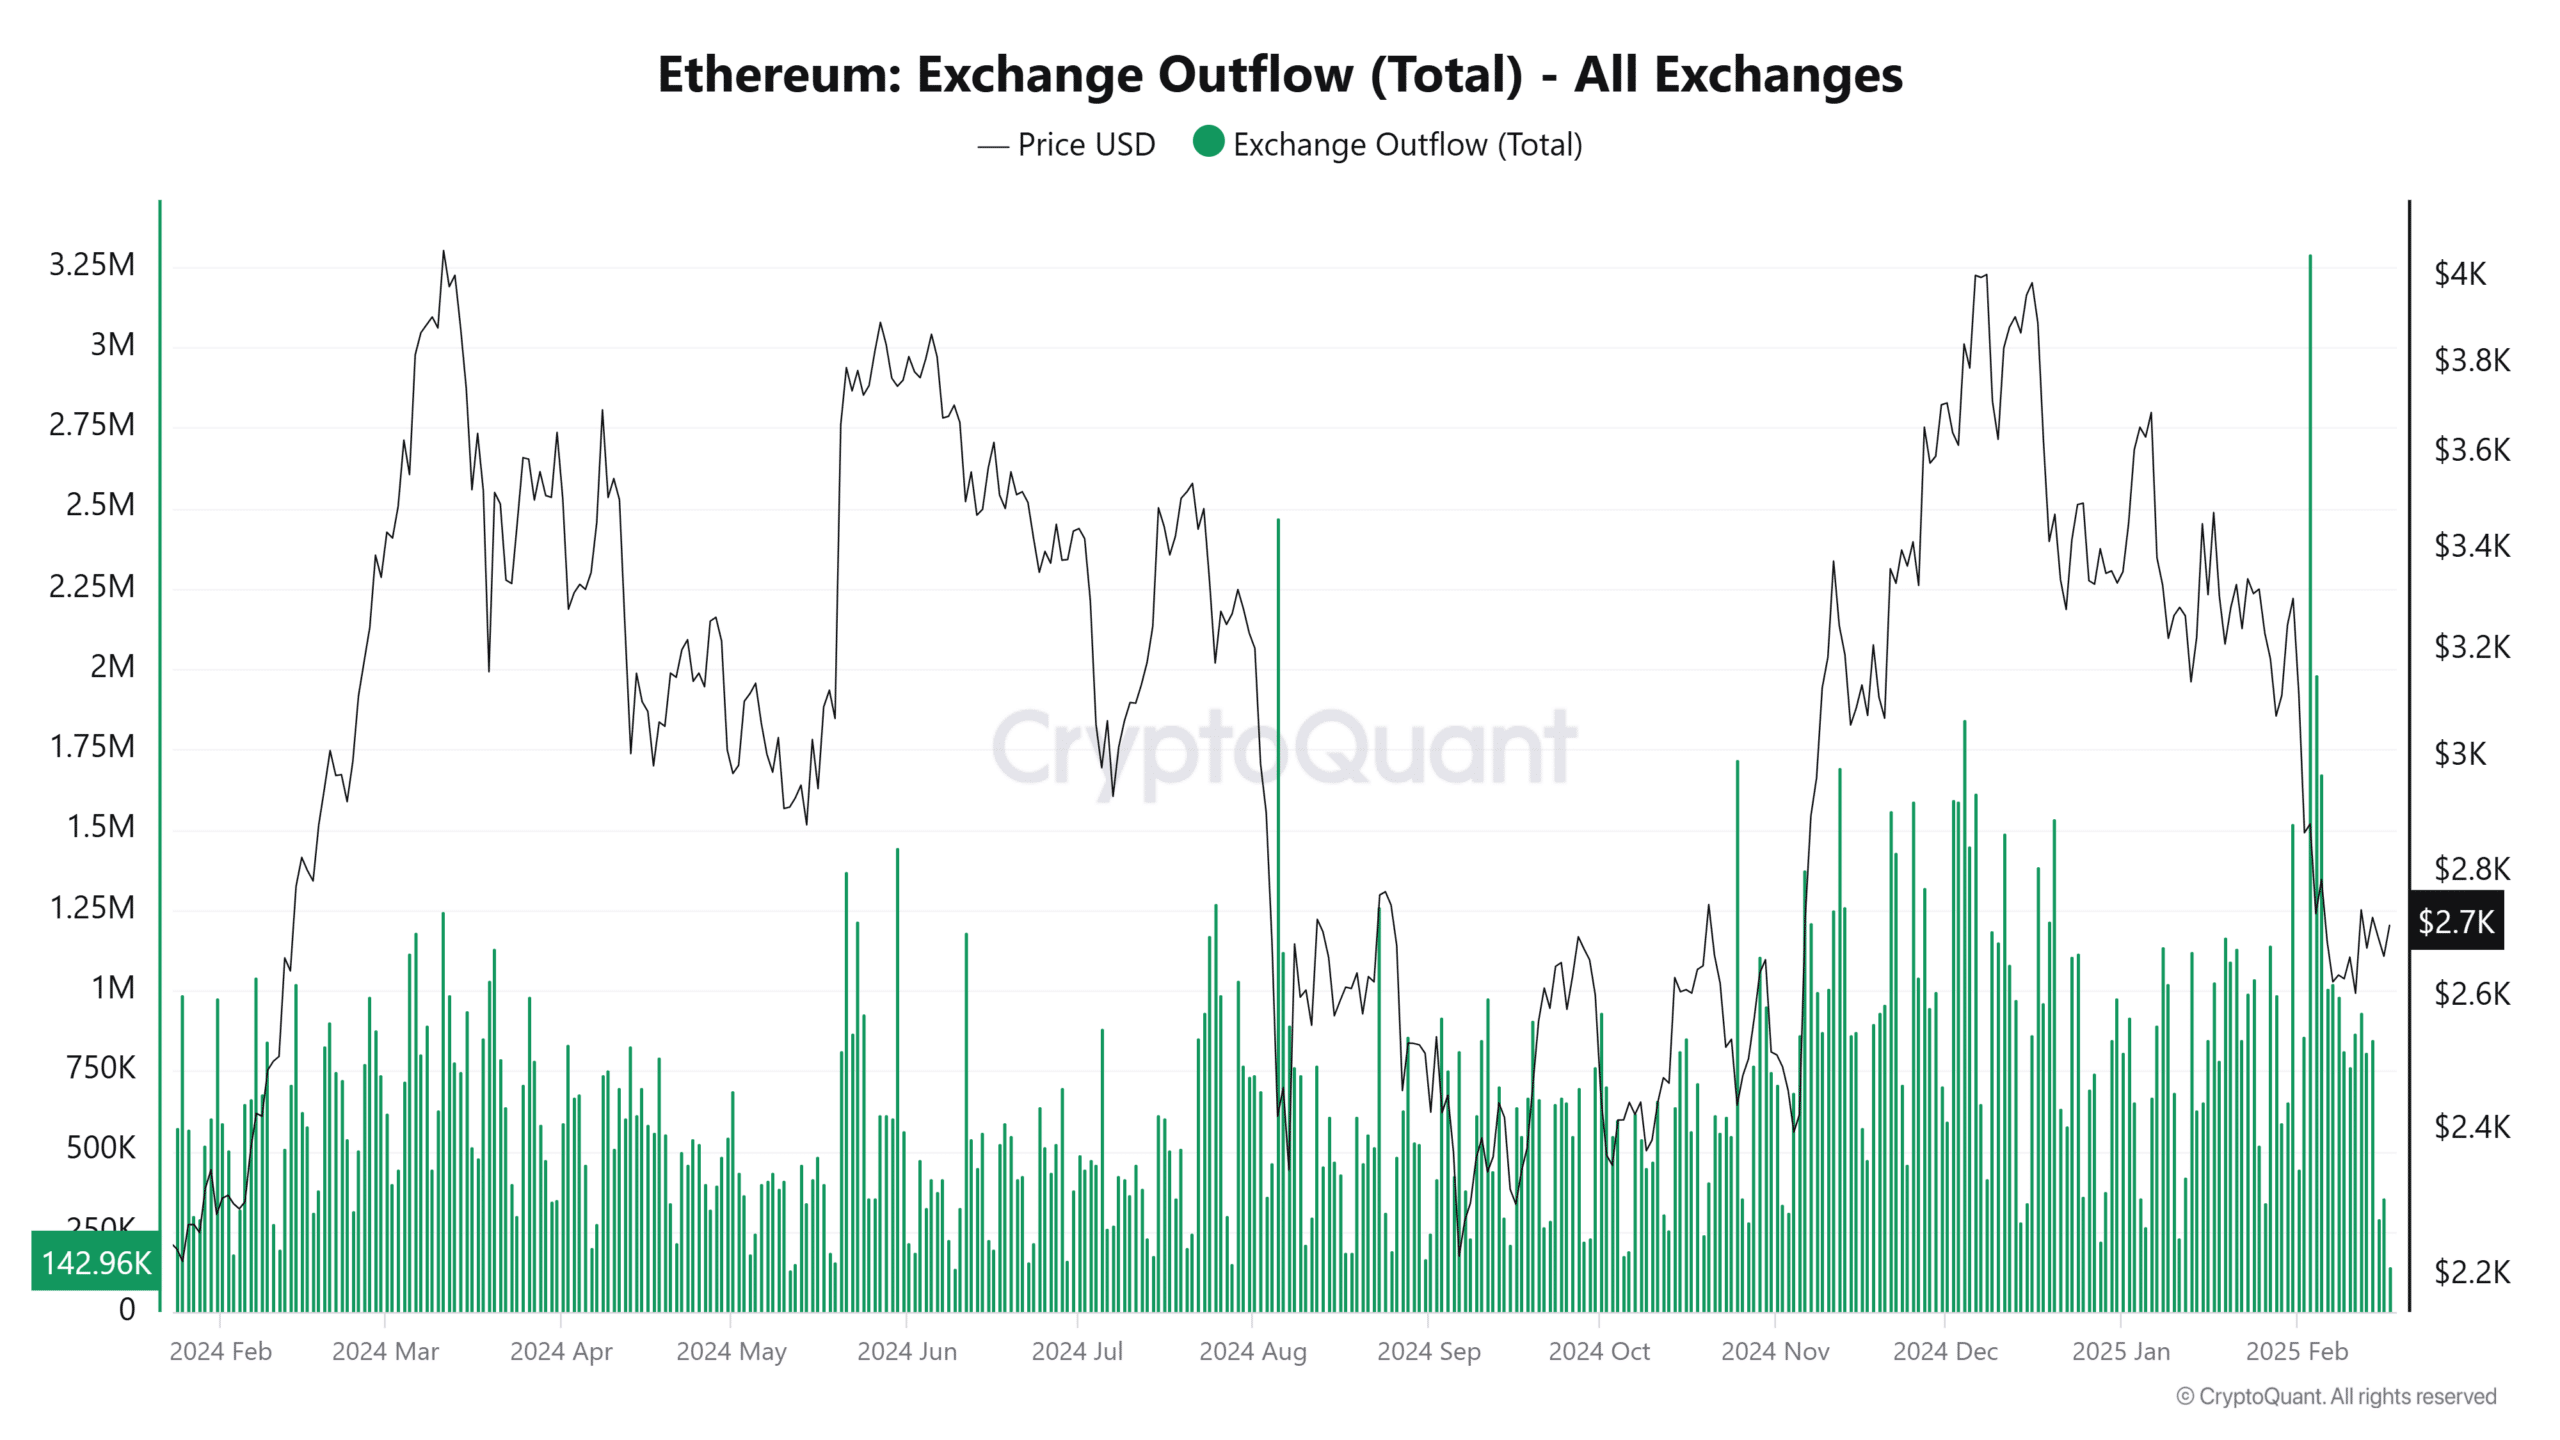
Source: Cryptoquant
Ethereum’s Net Exchange Outflows have remained high over the past three months, signaling strong accumulation as investors opt for self-custody and staking over short-term trading.
Historically, such trends have preceded major price surges by reducing available supply.
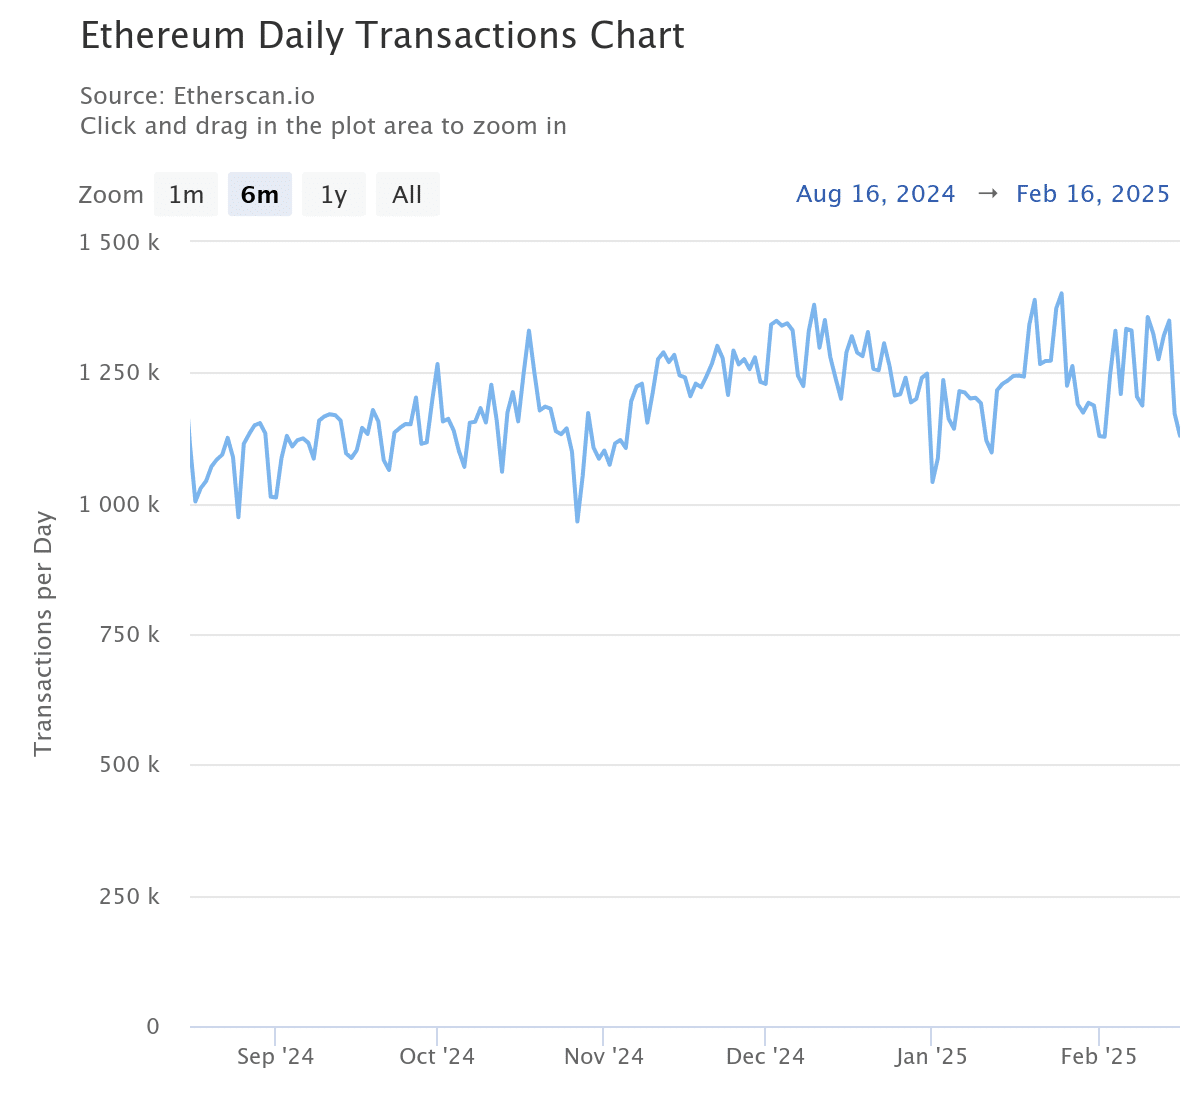
Source: Etherscan.io
On-chain data further supports this shift, with daily transactions consistently exceeding one million, indicating steady network usage.
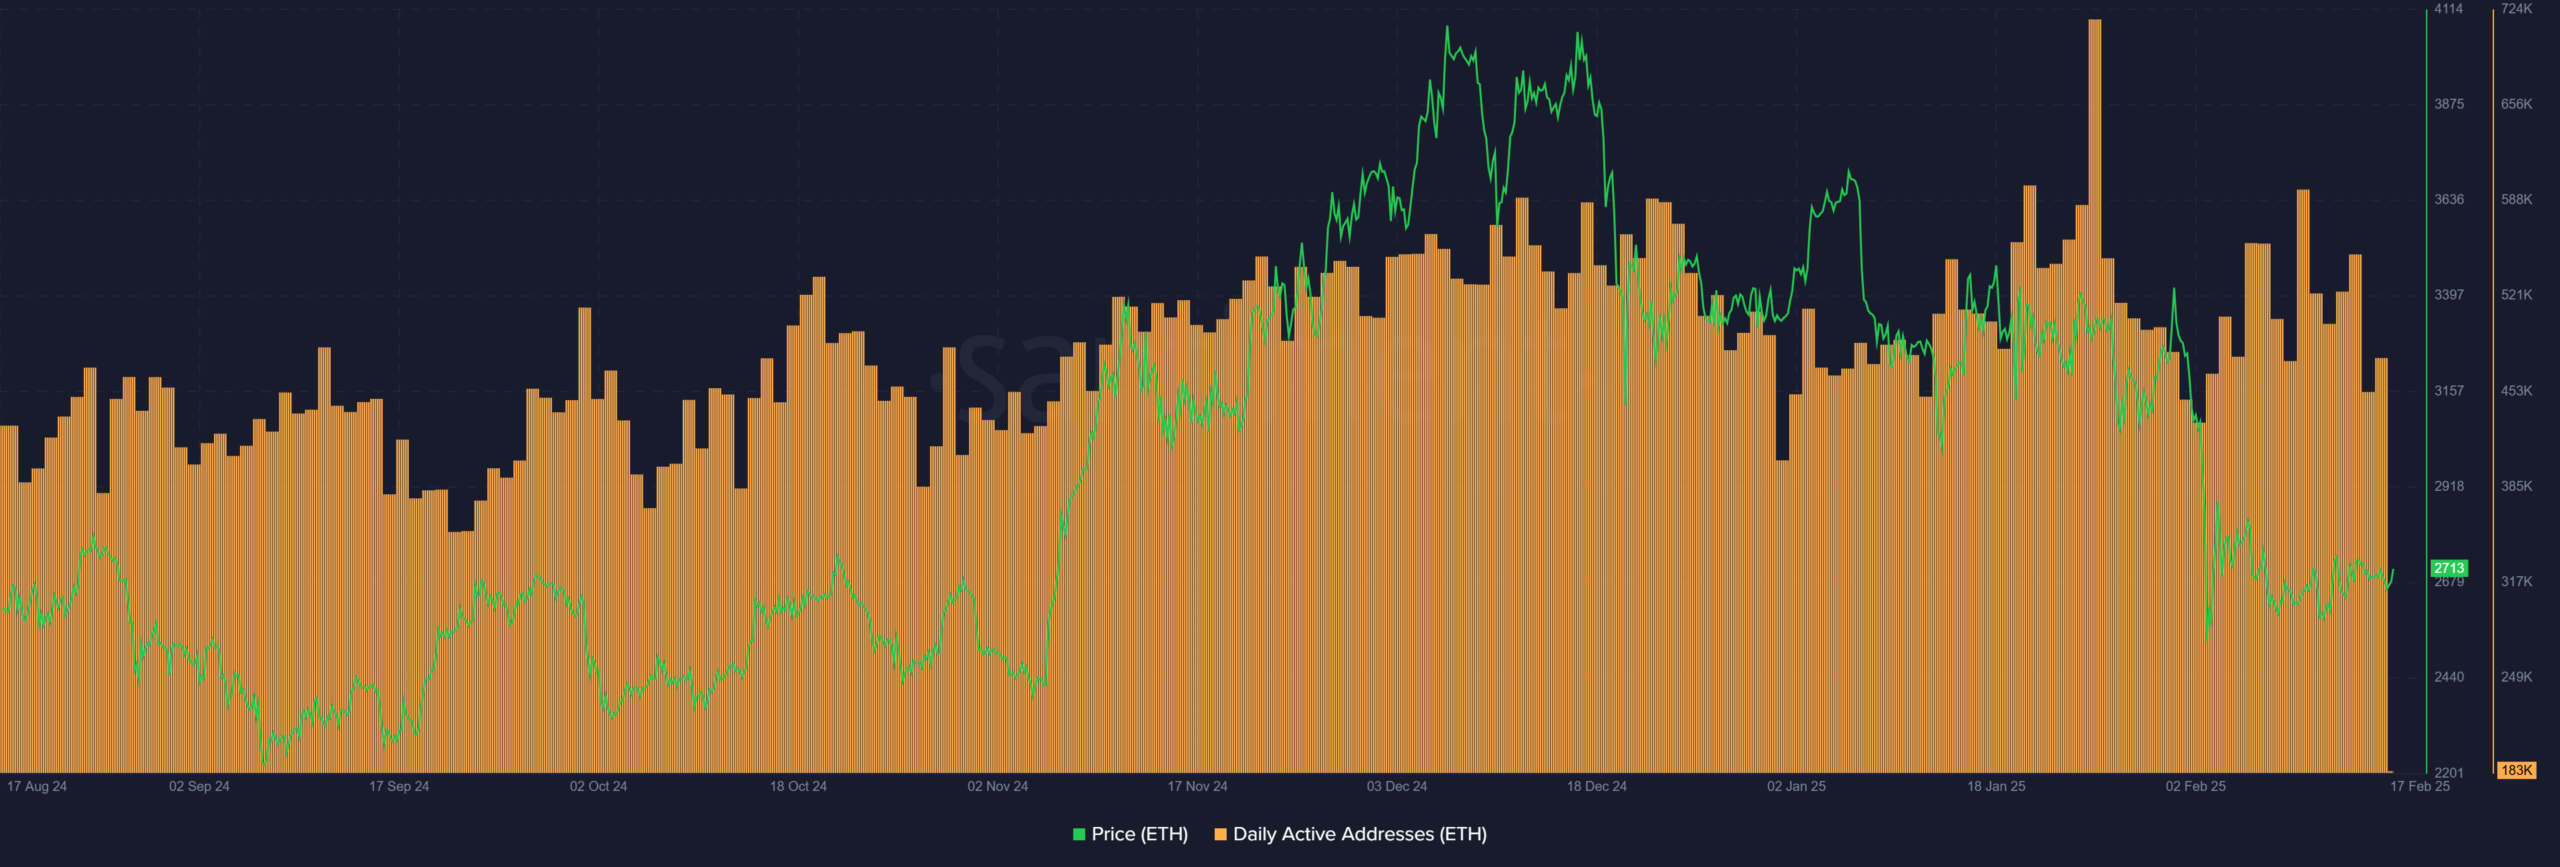
Source: Santiment
However, fluctuations in active addresses suggest that while existing users remain engaged, new user adoption isn’t accelerating at the same pace. This could mean that institutional accumulation, rather than broad retail demand, is driving Ethereum’s price action.
Ethereum at a crossroads: Breakout or prolonged consolidation?
Ethereum’s recent price action suggests a phase of consolidation following its previous decline. The daily chart reveals that ETH is currently trading below both the 50-day and 200-day SMAs, indicating that the broader trend remains cautious.
However, the RSI hovers around 41.49, signaling that ETH is neither overbought nor oversold, which could point to an accumulation phase.
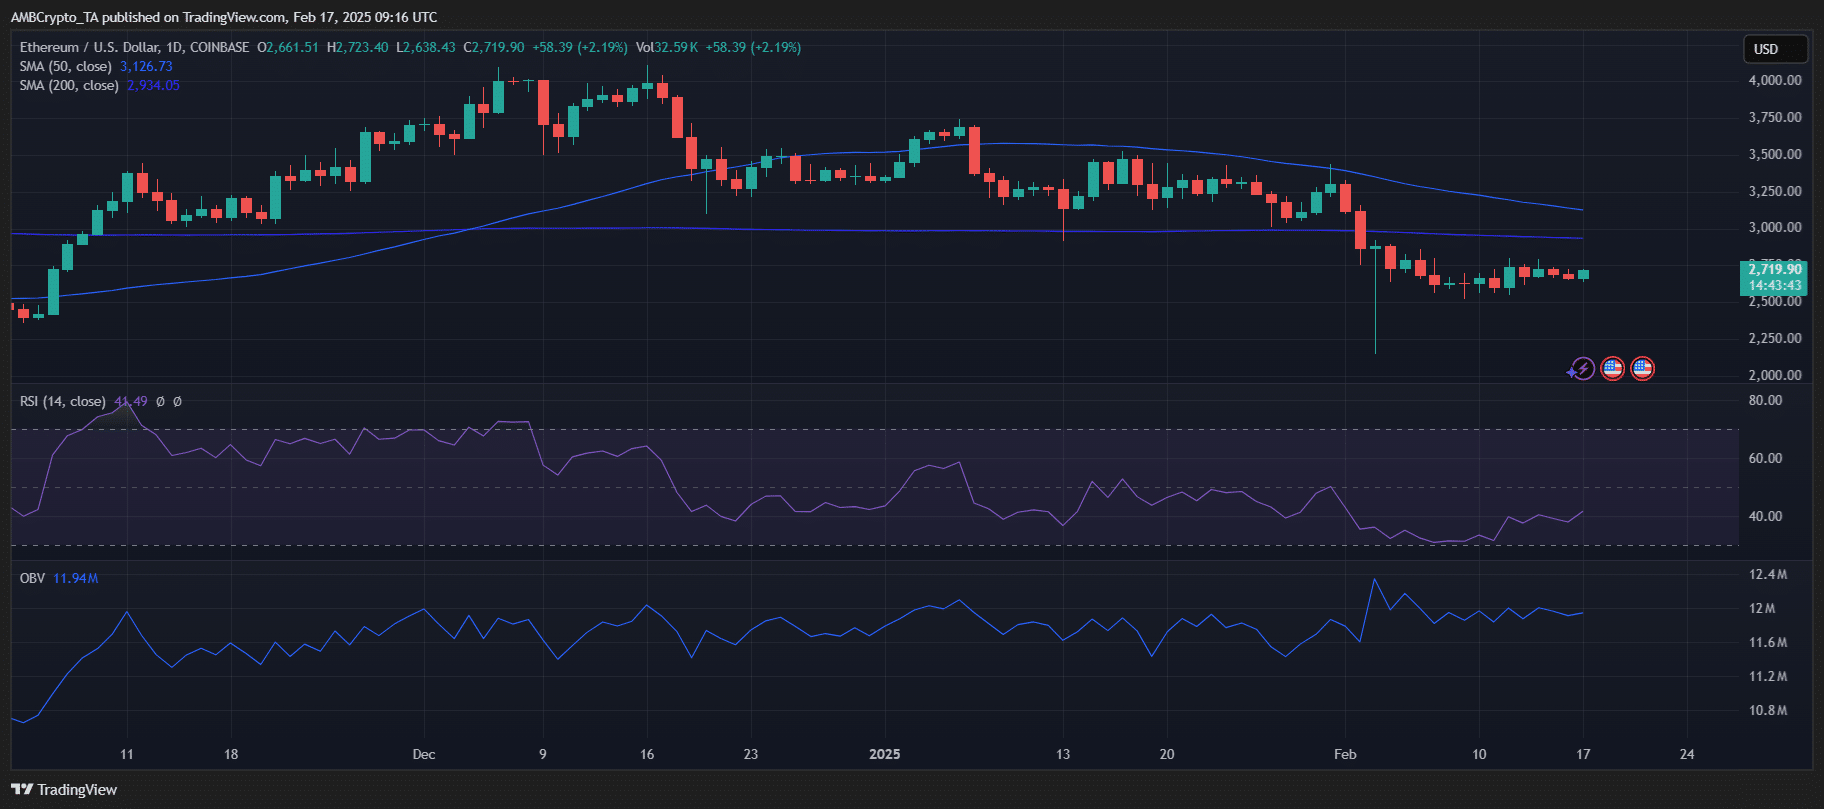
Source: TradingView
Furthermore, OBV remains steady, hinting that volume inflows have not significantly weakened despite recent price fluctuations.
If buying momentum strengthens, Ethereum could reclaim key resistance levels, potentially confirming a breakout scenario.
Conversely, failure to break above the 50-day SMA could lead to prolonged sideways movement or even a retest of lower support levels.