Close Menu
    What's Hot

    Ethereum Enters Strategic Pause: Will Accumulation Below Resistance Spark A Surge?

    Solana indicators point north, bulls test $165 target

    Cardano is at the Nexus of Bitcoin DeFi: Charles Hoskinson

    Facebook X (Twitter) Instagram
    yeek.io
    • Crypto Chart
    • Crypto Price Chart
    X (Twitter) Instagram TikTok
    Trending Topics:
    • Altcoin
    • Bitcoin
    • Blockchain
    • Crypto News
    • DeFi
    • Ethereum
    • Meme Coins
    • NFTs
    • Web 3
    yeek.io
    • Altcoin
    • Bitcoin
    • Blockchain
    • Crypto News
    • DeFi
    • Ethereum
    • Meme Coins
    • NFTs
    • Web 3
    Meme Coins

    FLOKI: Why traders should watch these zones in the coming days

    Yeek.ioBy Yeek.ioMay 13, 2025No Comments2 Mins Read
    Share Facebook Twitter Pinterest Copy Link Telegram LinkedIn Tumblr Email
    Share
    Facebook Twitter LinkedIn Pinterest Email
    • FLOKI was likely to see a short-term pullback before rallying toward the next Fibonacci retracement level.
    • The bullish structure on the 1-day timeframe after the prolonged downtrend in 2025 was hugely encouraging for buyers.

    FLOKI [FLOKI] witnessed a 107% increase in its daily trading volume, according to CoinMarketCap data at press time.

    During this time, there was high volatility, with a 17% rally to local highs at $0.000123 followed by a nearly 10% drop to $0.000109.

    This short-term volatility and the liquidation heatmap hinted at the chance for a deeper pullback for the meme coin.

    For investors and traders with a longer time horizon, FLOKI has a bullish outlook, helped by the swift Bitcoin [BTC] gains in May.

    The high demand for FLOKI could make for another 22% rally

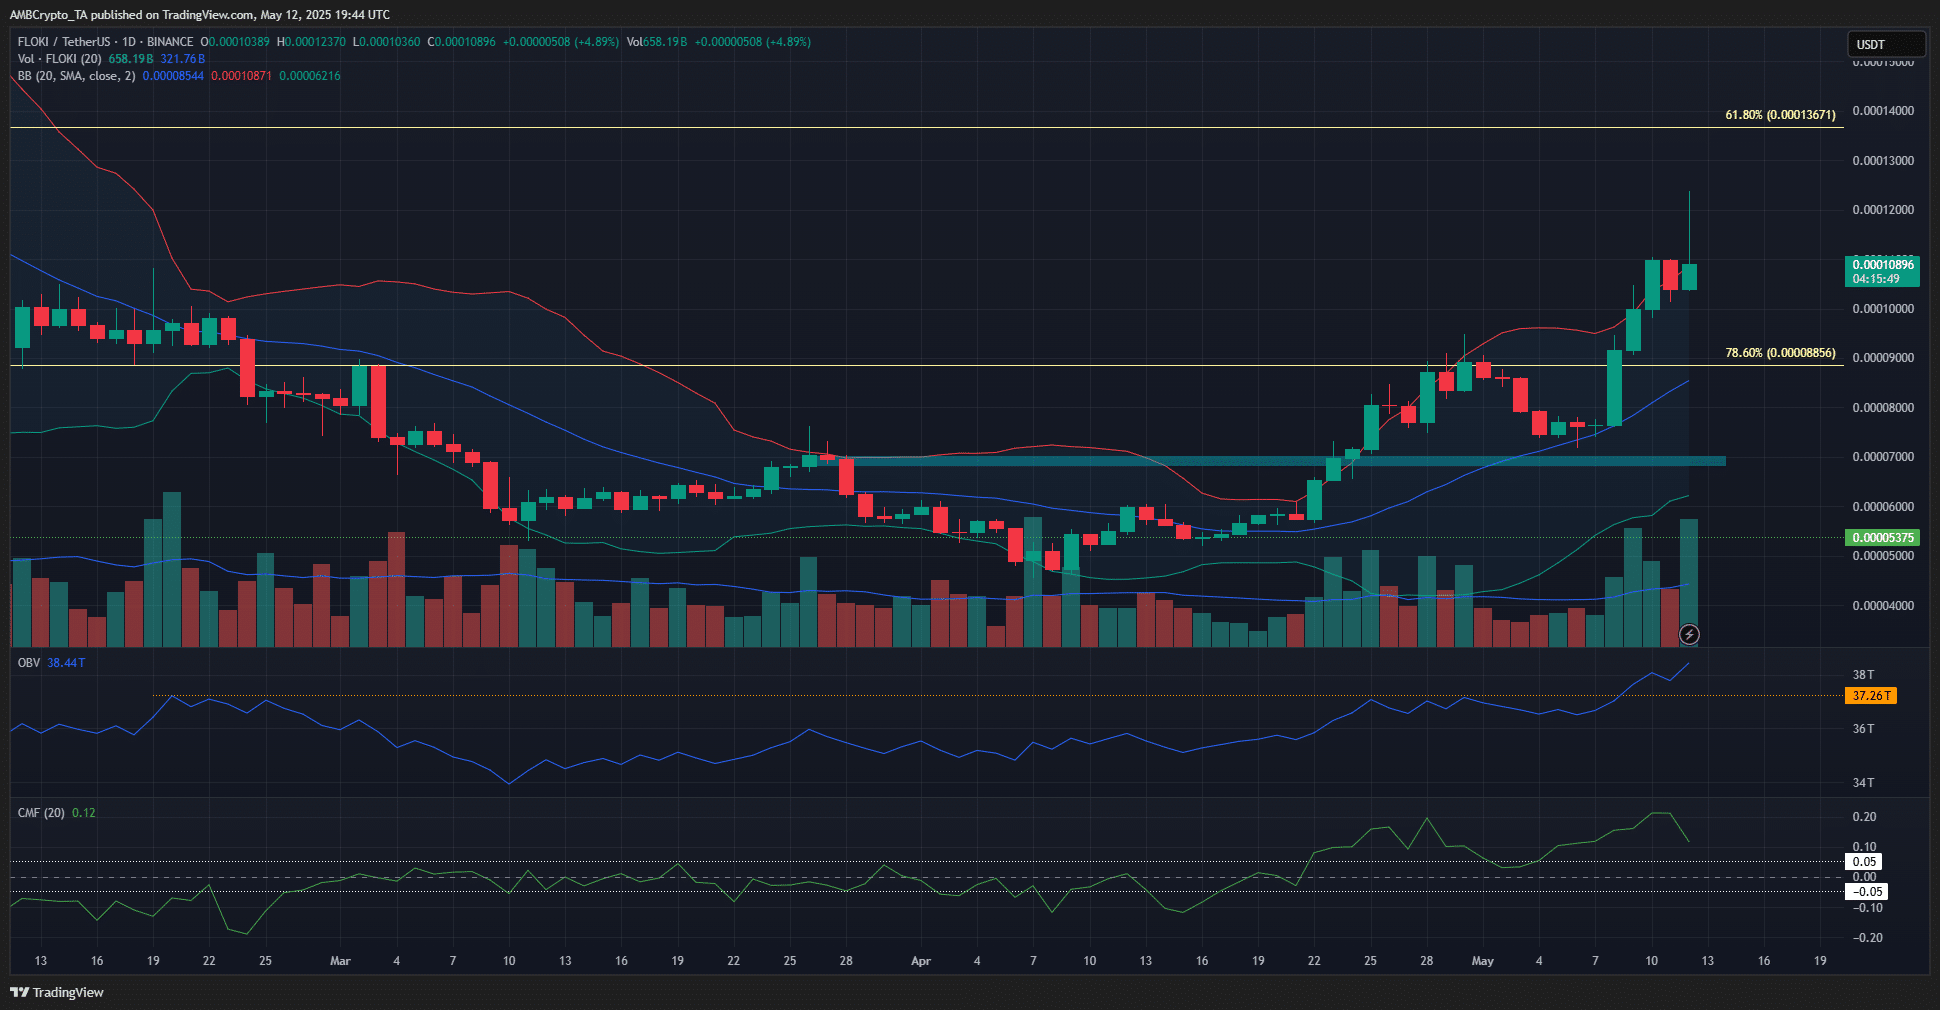
    FLOKI 1-day Chart

    Source: FLOKI/USDT on TradingView

    FLOKI presented a bearish order block at $0.0000695, formed by the lower high formed in March.

    Highlighted in cyan, this area was breached in April and nearly retested as a demand zone a week ago. The move beyond this area meant it was now a bullish breaker block.

    This bullish structure break and the sustained rally in May came alongside increased demand for FLOKI. The OBV has broken above the local highs formed in February and retested unsuccessfully in April.

    Similarly, the CMF was well above +0.05 to indicate strong capital inflows to the market.

    FLOKI had been in a downtrend since mid-December.

    The rally past the bullish breaker block and the heightened demand meant that the 61.8% Fibonacci retracement level, plotted based on the November rally, was the next bullish target.
    FLOKI 3-month Liquidation HeatmapFLOKI 3-month Liquidation Heatmap

    Source: Coinglass

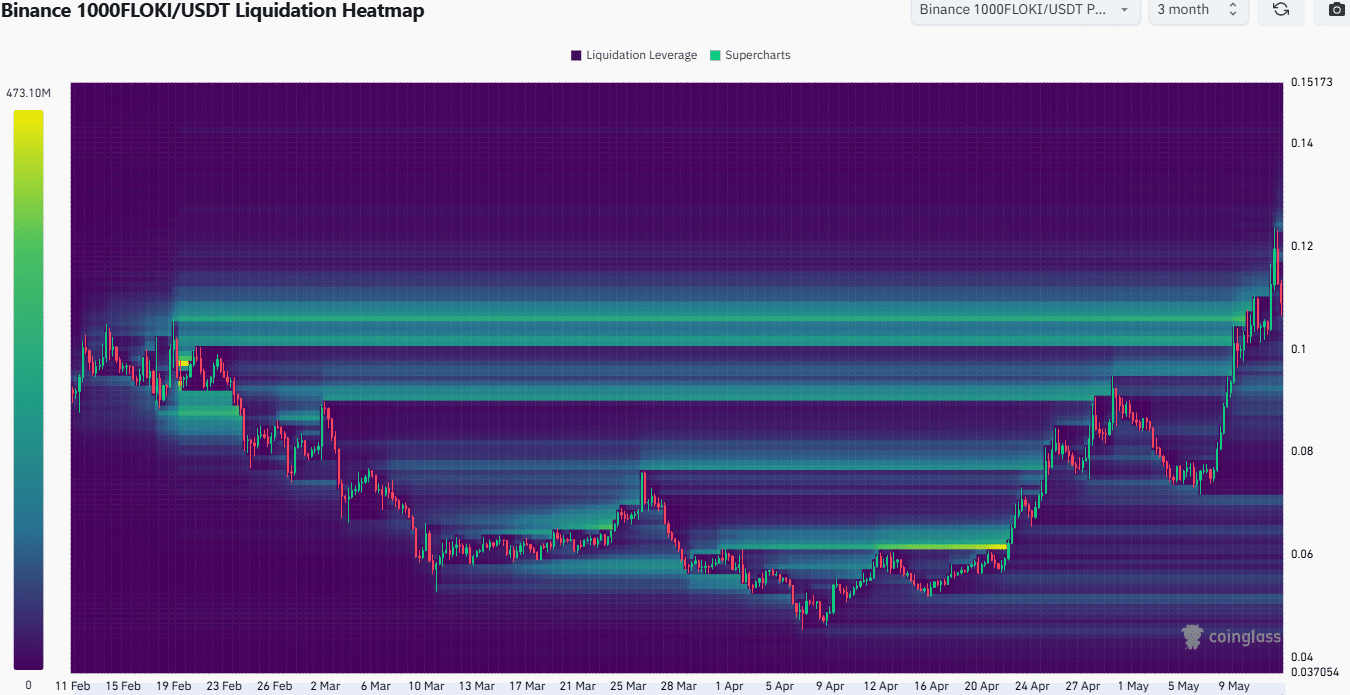
    The 3-month liquidation heatmap highlighted the build-up of liquidation levels around the $0.000107 area, the highs from February. This magnetic zone has successfully pulled prices higher.
    FLOKI 1-week Liquidation HeatmapFLOKI 1-week Liquidation Heatmap

    Source: Coinglass

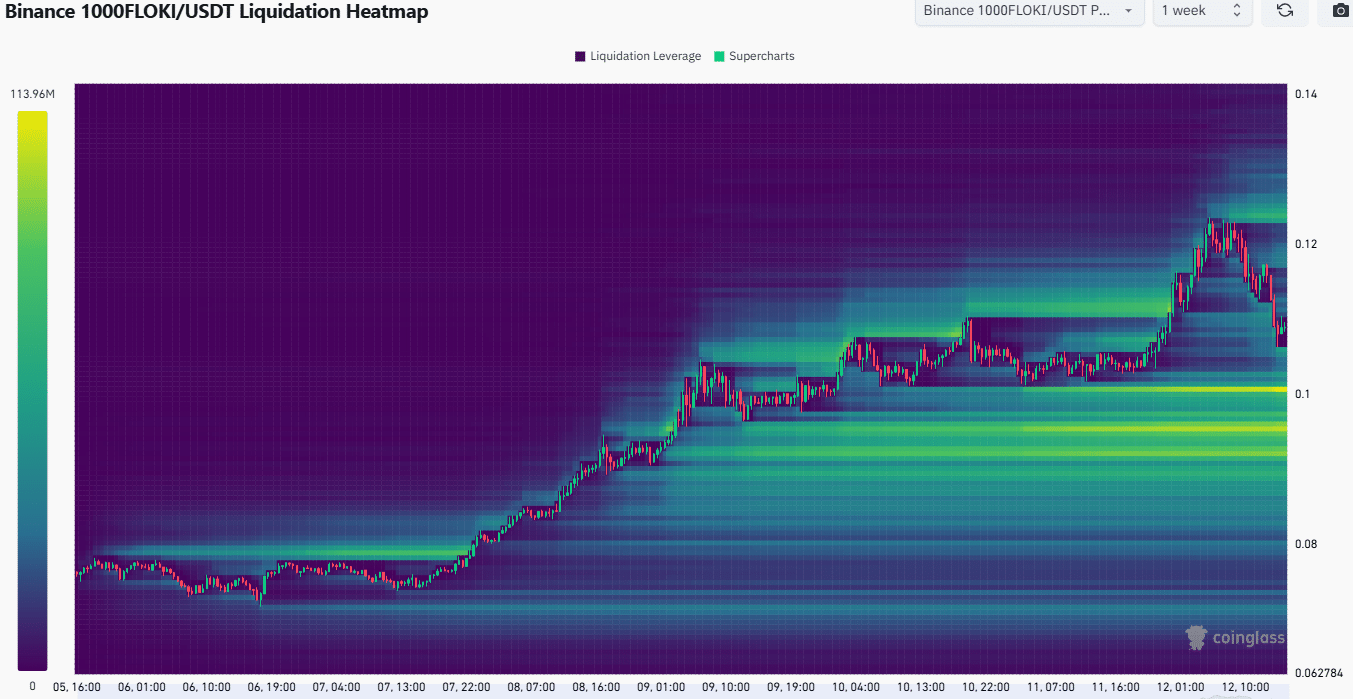
    Zooming in, the 1-week liquidation heatmap showed where the next price move could go. The $0.0001 and $0.000092-$0.000095 area was found to be liquidity clusters that could be swept in the coming days.

    A dip to these levels would likely see a bullish reaction. Traders and investors can be prepared for this possibility while keeping an eye on Bitcoin, just in case its trend turns bearish and adversely affects FLOKI.

    Disclaimer: The information presented does not constitute financial, investment, trading, or other types of advice and is solely the writer’s opinion

    Next: Solana bulls eye $180, but will profit-taking spoil SOL’s rally?

    Follow on Google News Follow on Flipboard
    Share. Facebook Twitter Pinterest LinkedIn Tumblr Email Copy Link
    Previous ArticleCurve Finance battles DNS hijack days after X account breach
    Next Article ZKsync X accounts hacked to promote fake SEC warnings and malicious airdrop
    Avatar
    Yeek.io
    • Website

    Yeek.io is your trusted source for the latest cryptocurrency news, market updates, and blockchain insights. Stay informed with real-time updates, expert analysis, and comprehensive guides to navigate the dynamic world of crypto.

    Related Posts

    Dogecoin faces a sell wall – Will smart money hold or fold at $0.17?

    June 7, 2025

    Analyzing Dogecoin’s price recovery odds in the wake of Trump-Musk spat

    June 7, 2025

    Examining PENGU’s 9% pump – Will spot sell pressure ruin the bullish setup?

    June 7, 2025
    Leave A Reply Cancel Reply

    Advertisement
    Demo
    Latest Posts

    Ethereum Enters Strategic Pause: Will Accumulation Below Resistance Spark A Surge?

    Solana indicators point north, bulls test $165 target

    Cardano is at the Nexus of Bitcoin DeFi: Charles Hoskinson

    ChatGPT vs Cursor.ai vs Windsurf

    Popular Posts
    Advertisement
    Demo
    X (Twitter) TikTok Instagram

    Categories

    • Altcoin
    • Bitcoin
    • Blockchain
    • Crypto News

    Categories

    • Defi
    • Ethereum
    • Meme Coins
    • Nfts

    Quick Links

    • Home
    • About
    • Contact
    • Privacy Policy

    Important Links

    • Crypto Chart
    • Crypto Price Chart
    © 2025 Yeek. All Copyright Reserved

    Type above and press Enter to search. Press Esc to cancel.