
Key Takeaways
Why is BONK up today?
Because buyers — especially whales — stepped in aggressively after the recent dip, flipping market dominance back to the buy side.
What confirms the renewed demand?
A 111% surge in volume, 4.3T in buy orders over three days, and a positive Buy-Sell Delta of 300B signal strong accumulation.
After a period of prolonged downtrend, BONK reached a bottom.
The memecoin has closed at higher highs since hitting a local low of $0.00000844 four days ago.
In fact, on the daily charts, Bonk [BONK] rallied 13.25%, hitting a high of $0.0000103 before slightly retracing to $0.00001007 at press time.
Over the same period, its volume surged 111% to $194 million, indicating increased capital inflows. But why is BONK up today?
BONK buyers buy the dip
Significantly, as BONK declined, holders and investors turned to aggressive selling, fearing more losses.
As such, sellers had dominated the market until days ago, when buyers stepped in to buy the dip. As a result, buyers have retaken the spot market, as evidenced by Spot Taker CVD.
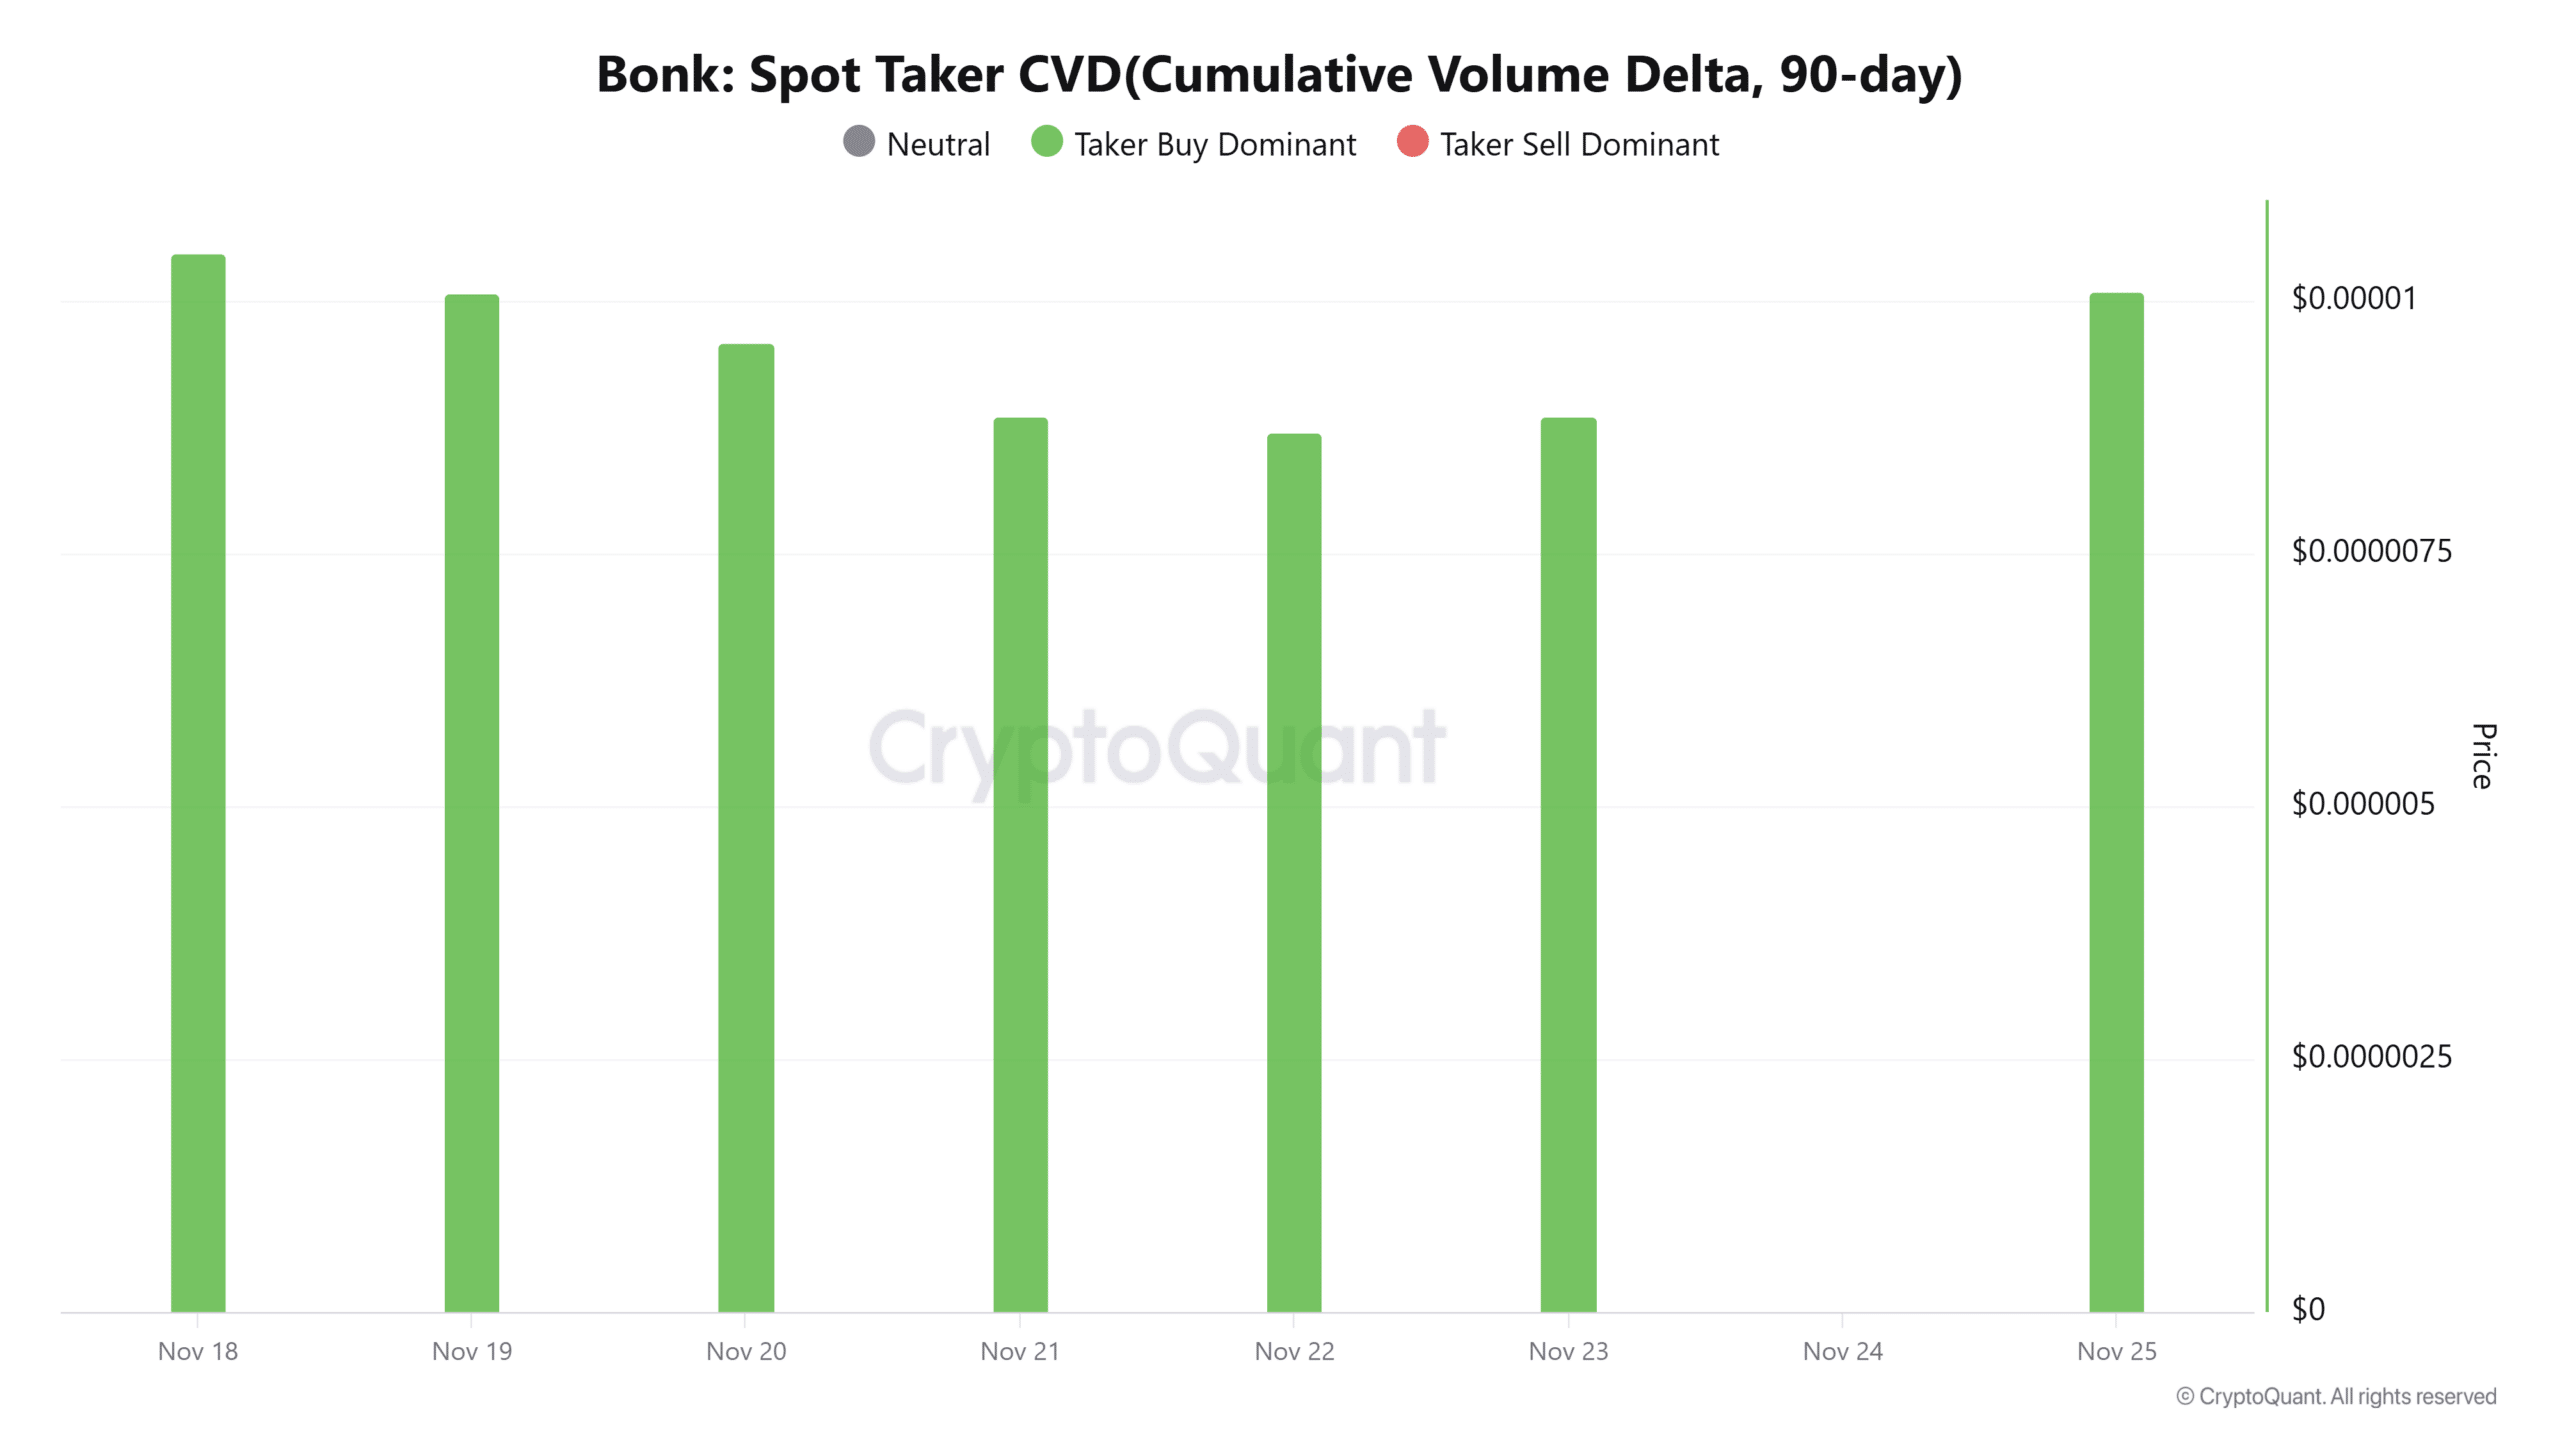
Source: CryptoQuant
According to CryptoQuant, this metric has shown buyer dominance over the past seven days, reflecting sustained demand.
Historically, buyers’ dominance has preceded stellar price performance in an asset’s price charts.
Significantly, these demands have been more prevalent in the past three days. Over this period, the memecoin recorded 4.3 trillion in Buy Volume.
This buying pressure skyrocketed in the past 24 hours, with the memecoin recording 2.4 trillion in Buy volume compared to 2.2 trillion in Sell Volume.
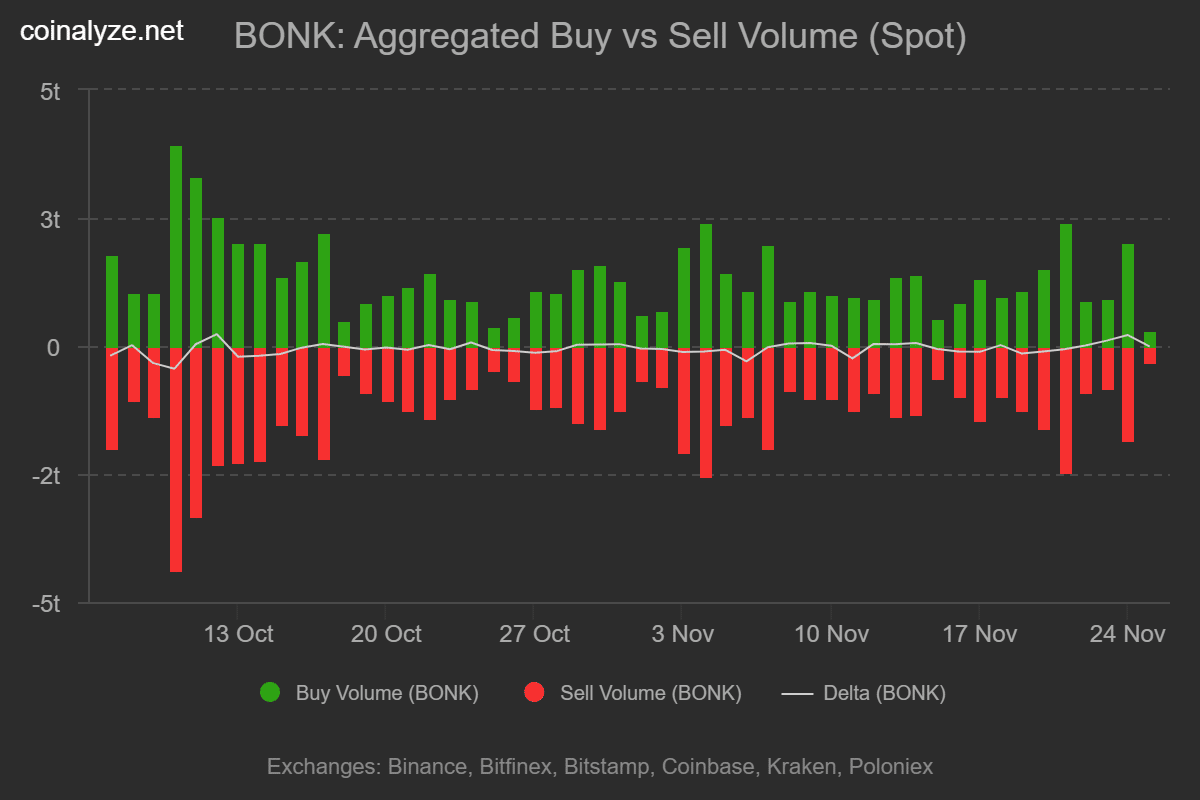
Source: Coinalyze
As a result, the memecoin recorded a Buy Sell Delta of 300 billion, a clear sign of aggressive spot accumulation.
Whales take charge
Interestingly, some of the most active buyers in the market have been mostly whales. Spot Average Order Size data from CryptoQuant showed large whale orders.
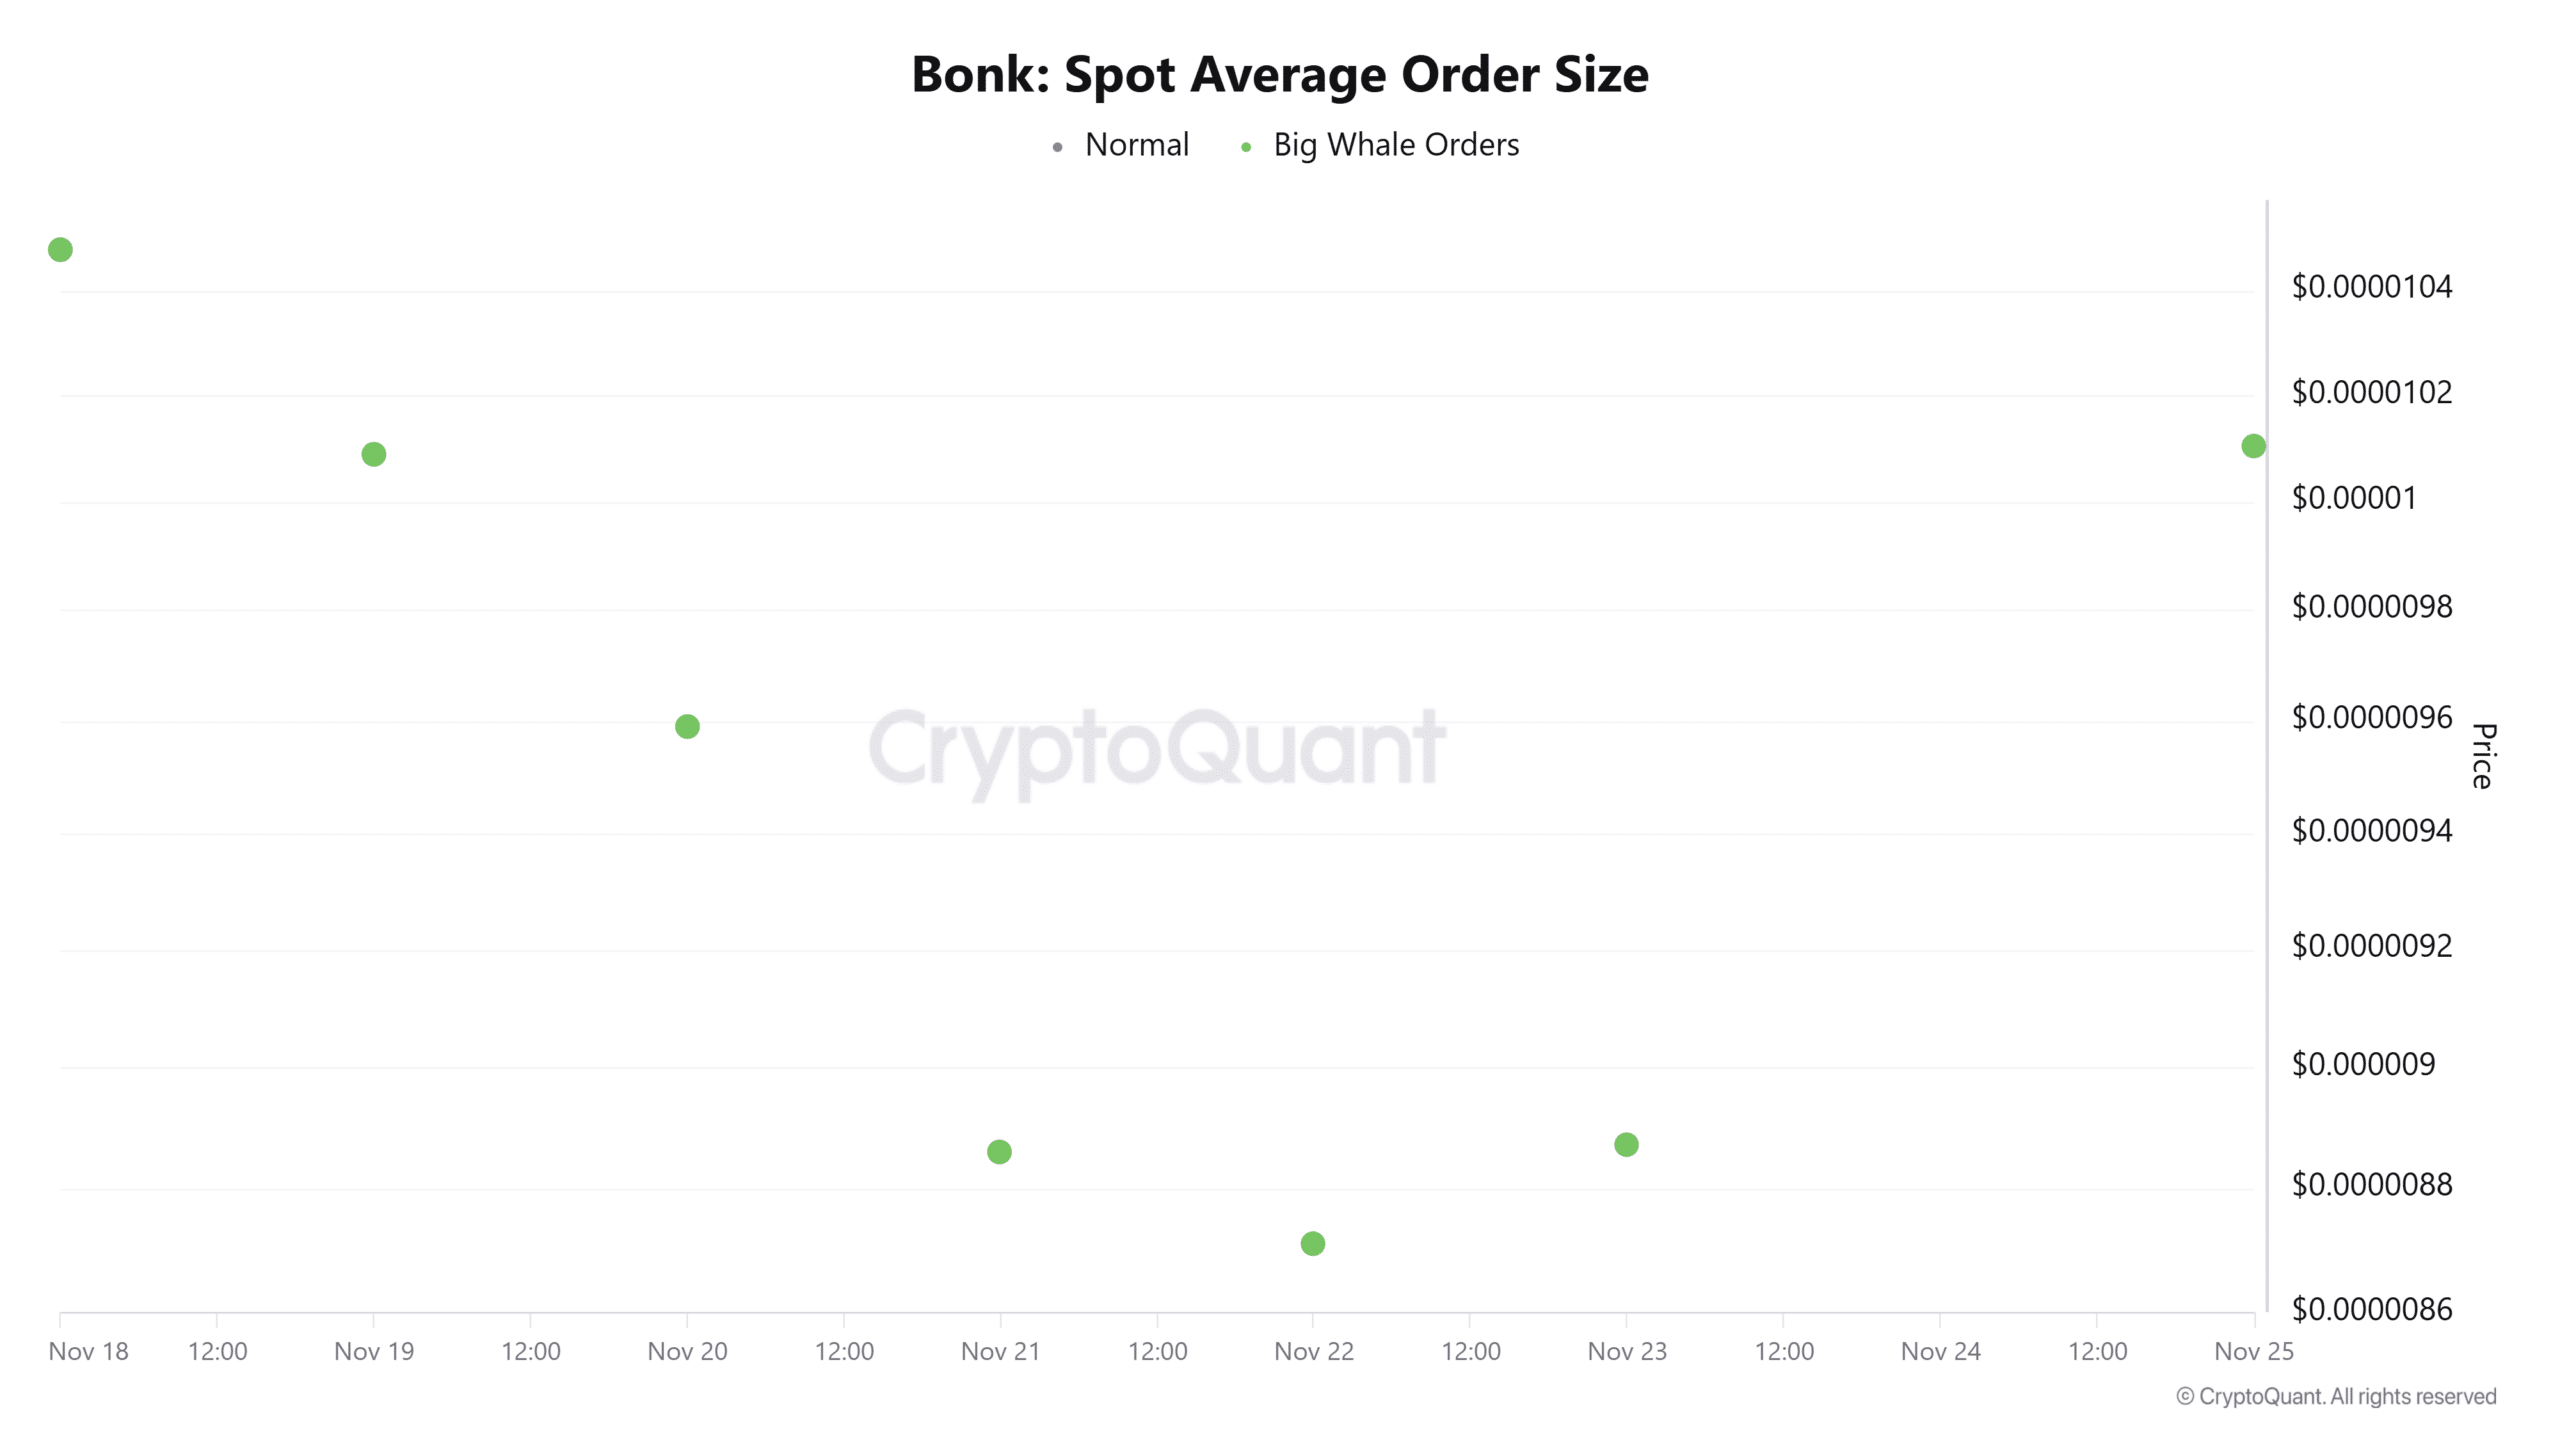
Source: CryptoQuant
Typically, large whale orders reflect increased participation from large entities, in this case, as they accumulate the memecoin.
Historically, increased whale accumulation has accelerated upward pressure on an asset’s price, driving prices higher.
Furthermore, exchange activities further echoed this accumulation trend. According to Coinglass, BONK’s Spot Netflow turned negative for the first time in three days.
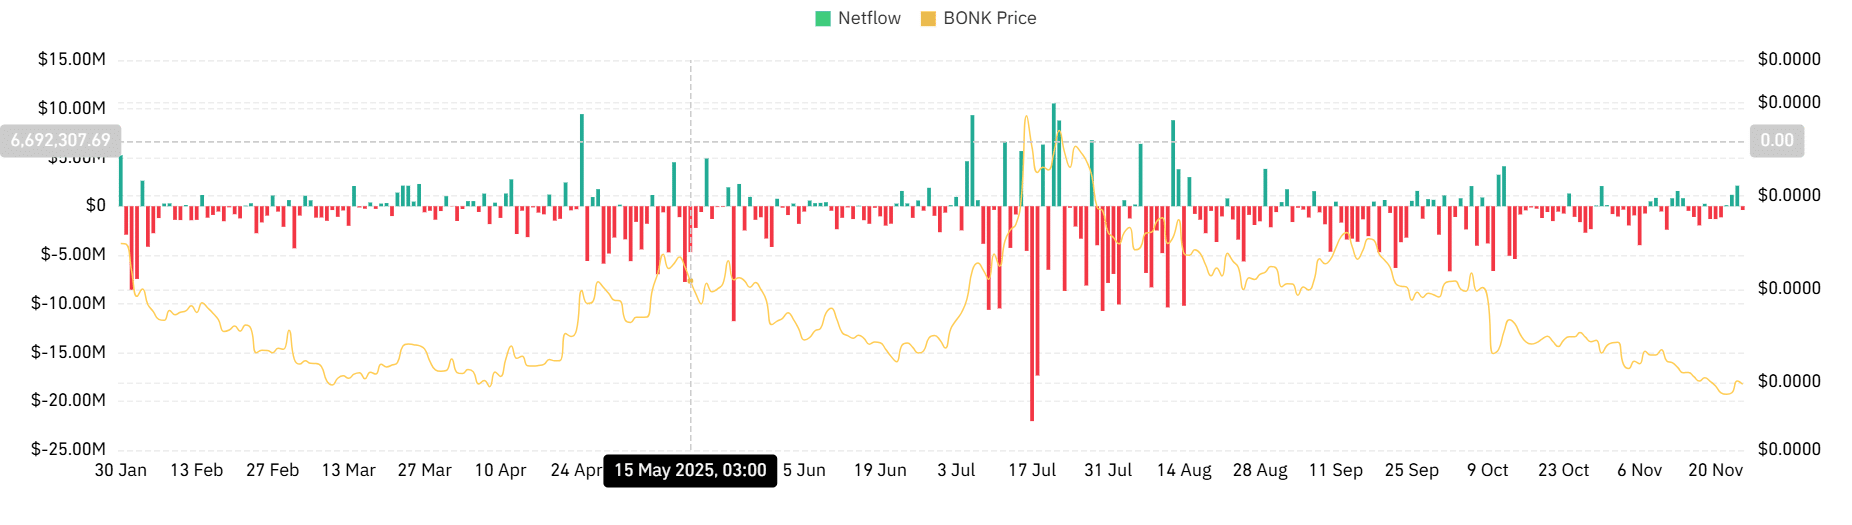
Source: CoinGlass
At press time, Netflow was -$385.6k, a significant drop from $2.11 million the previous day. Such a massive decline indicates increased outflows from the exchanges.
A start of a sustained uptrend?
According to AMBCrypto, BONK bounced back as buyers, including whales, stepped into the market to accumulate the memecoin.
For that reason, its Stochastic RSI surged to 68, signaling buyers’ dominance. At the same time, its Relative Vigor Index (RVGI) made a bullish crossover, validating the trend’s strength.
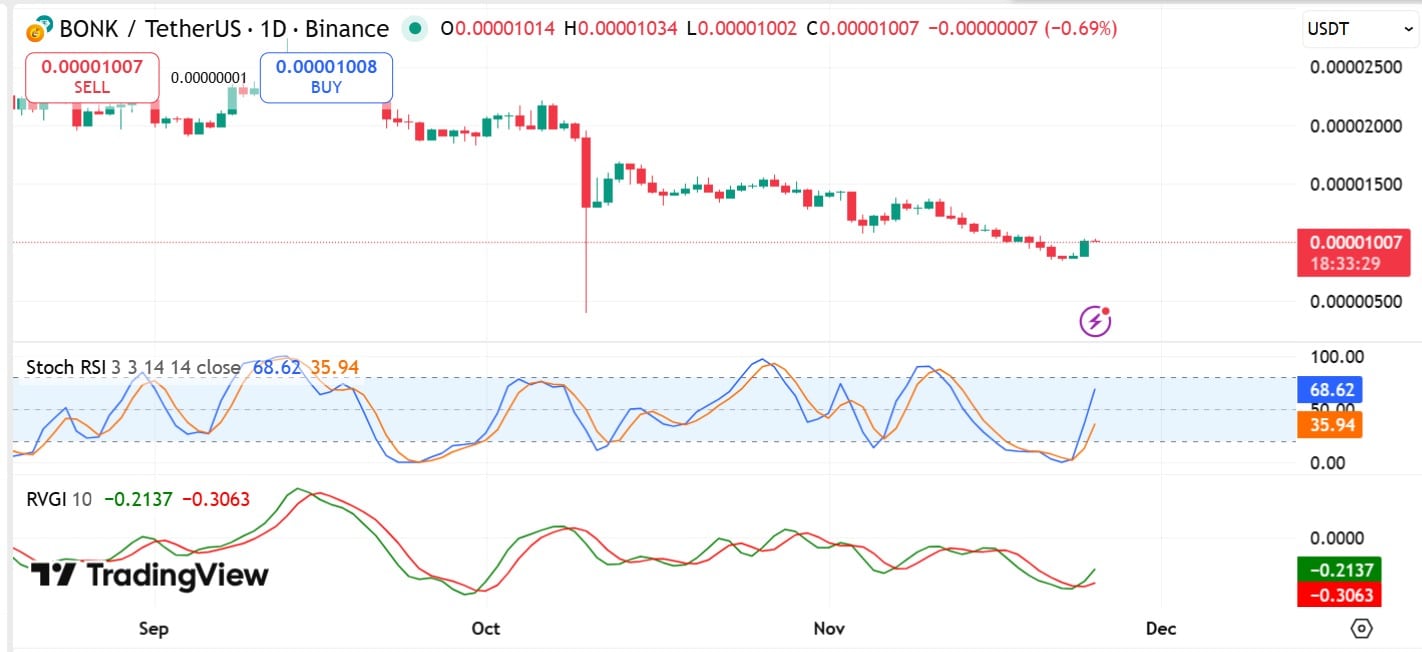
Source: TradingView
Typically, when momentum indicators are set this way, they signal potential trend continuation. Thus, if the recent demand holds, BONK will target $0.000011.
Hitting these levels will strengthen the memecoin and push it to $0.000013, completing the breakout. However, if demand dwindles quickly and profit takers emerge, BONK will drop to $0.000009.