
HYPE rallied to an intraday high of $39.6 on May 26, continuing a strong uptrend that began back on April 4 when it had bottomed out at just $9.
Hyperliquid (HYPE) was trading at $38.3 at press time, up by 315% from its April low and pushing its market capitalization to $12.85 billion.
The rally has been driven by surging trading volume, growing open interest, and rising network fees.
According to data from DeFiLlama, Hyperliquid’s seven-day volume climbed 13.36% to $78.67 billion, making it the most active player in DeFi right now.
In terms of derivatives trading, Hyperliquid has now processed over $1.56 trillion in perpetual futures volume, far exceeding Jupiter’s $310.9 billion, the second-largest platform in this space. This momentum has translated into a record-high open interest of $1.39 billion.
Perpetual futures, which are similar to traditional futures contracts but without expiration dates, have become a go-to tool for crypto traders. They let users apply leverage and aim for higher returns, something that’s helped fuel HYPE’s rise.
Additionally, weekly fee revenue reached an all-time high of $22.26 million, marking four consecutive weeks of fee growth. The spike in fees is especially important because Hyperliquid could potentially use a portion of it to buy back HYPE from the open market, which may boost the price by cutting down supply.
Adding to the momentum, Hyperliquid recently submitted two formal letters to the U.S. Commodity Futures Trading Commission in response to its call for public input on perpetual futures and 24/7 crypto trading.
The move was well received by the crypto community, with many praising Hyperliquid’s proactive engagement with regulators. HYPE shot up roughly 15% within hours after the announcement.
Institutional and large investor interest in HYPE also appears to be rising. According to blockchain data shared by Lookonchain, two whale addresses recently acquired approximately $10.09 million worth of HYPE. Such large transactions often trigger follow-on demand from retail investors who track whale activity as a sentiment indicator.
This retail interest is already visible. Google Trends data shows a sharp spike in search volume for “HYPE,” which further confirms an uptick in interest among retail users, and is often a precursor to increased trading activity and market momentum..
Technically, things are looking just as strong. On the 4-hour chart, HYPE recently broke out of a symmetrical triangle pattern, a common bullish signal. It’s also trading well above both the 20-day and 50-day simple moving averages, which points to a solid uptrend and usually acts as a buy signal for many traders.
On top of that, HYPE appears to be forming a textbook cup-and-handle pattern. This pattern, often seen as a bullish continuation setup, includes a rounded bottom, a horizontal resistance, and a short consolidation phase.
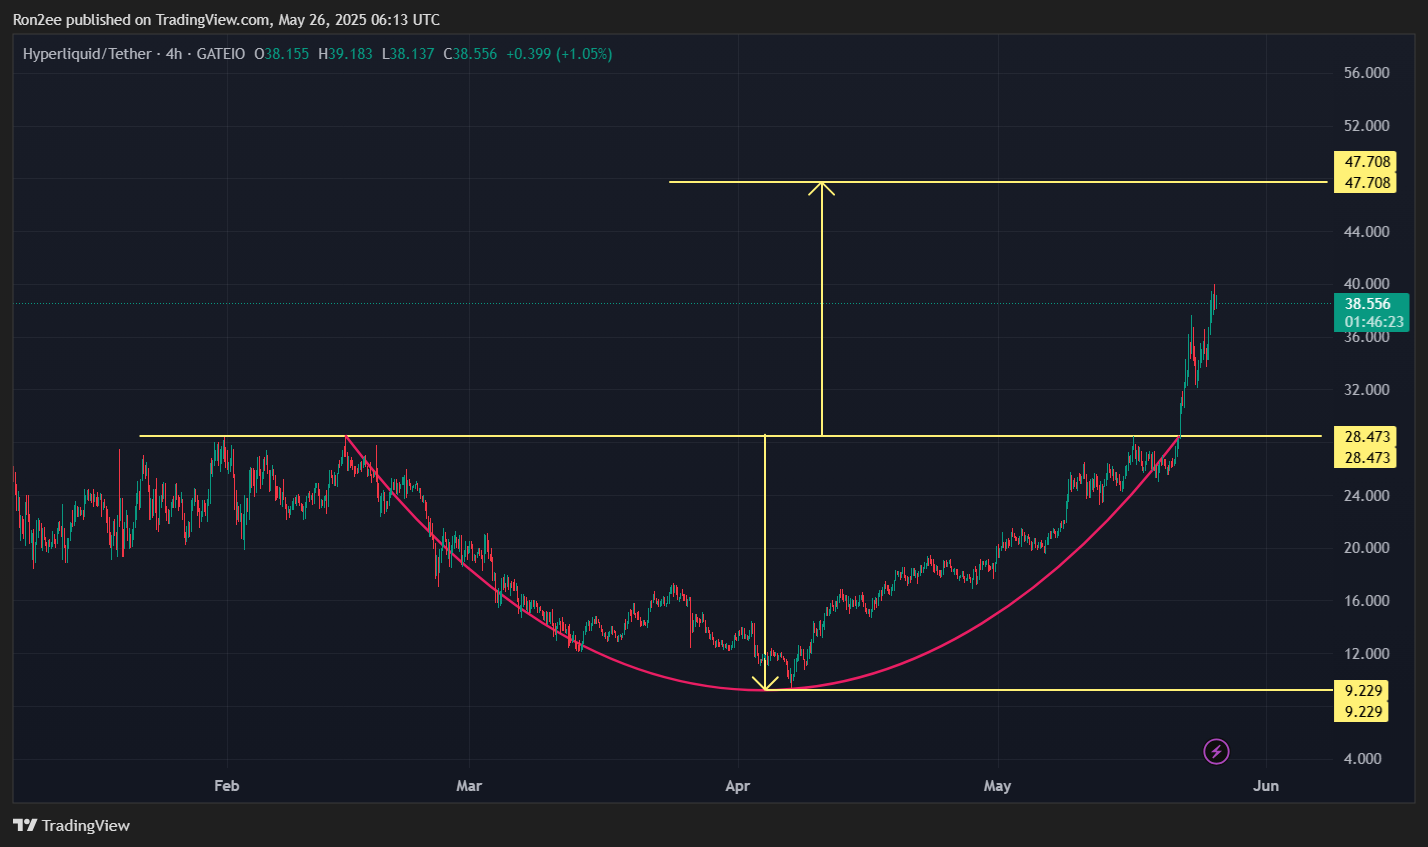
In HYPE’s case, the “cup” had a depth of around 67.6% on the 4-hour/USDT chart, and if this pattern plays out fully, the projected target would be around $47.7, roughly 24.5% higher than current levels.
Disclosure: This article does not represent investment advice. The content and materials featured on this page are for educational purposes only.