
- On-chain data revealed that most POL tokens were accumulated between $0.364 and $0.509
- Failure to reclaim $0.59 could trigger another sell-off as POL investors look to minimize losses
Polygon’s (POL) on-chain data underlined a concentration of accumulation within the price range of $0.364 to $0.509. This range, where about 9.97 Billion POL seemed to be out of the money, pointed to the importance of these levels as potential support or resistance zones.
With POL trading at $0.330 on the charts, a sustained move above this accumulation range could signal strength and potential bullish momentum.
Historically, POL levels where large volumes of tokens were purchased often became pivotal in future price movements. If POL reclaims its $0.50 range consistently, it would likely reassure investors – Potentially leading to a stabilization or a hike in price as confidence grows.
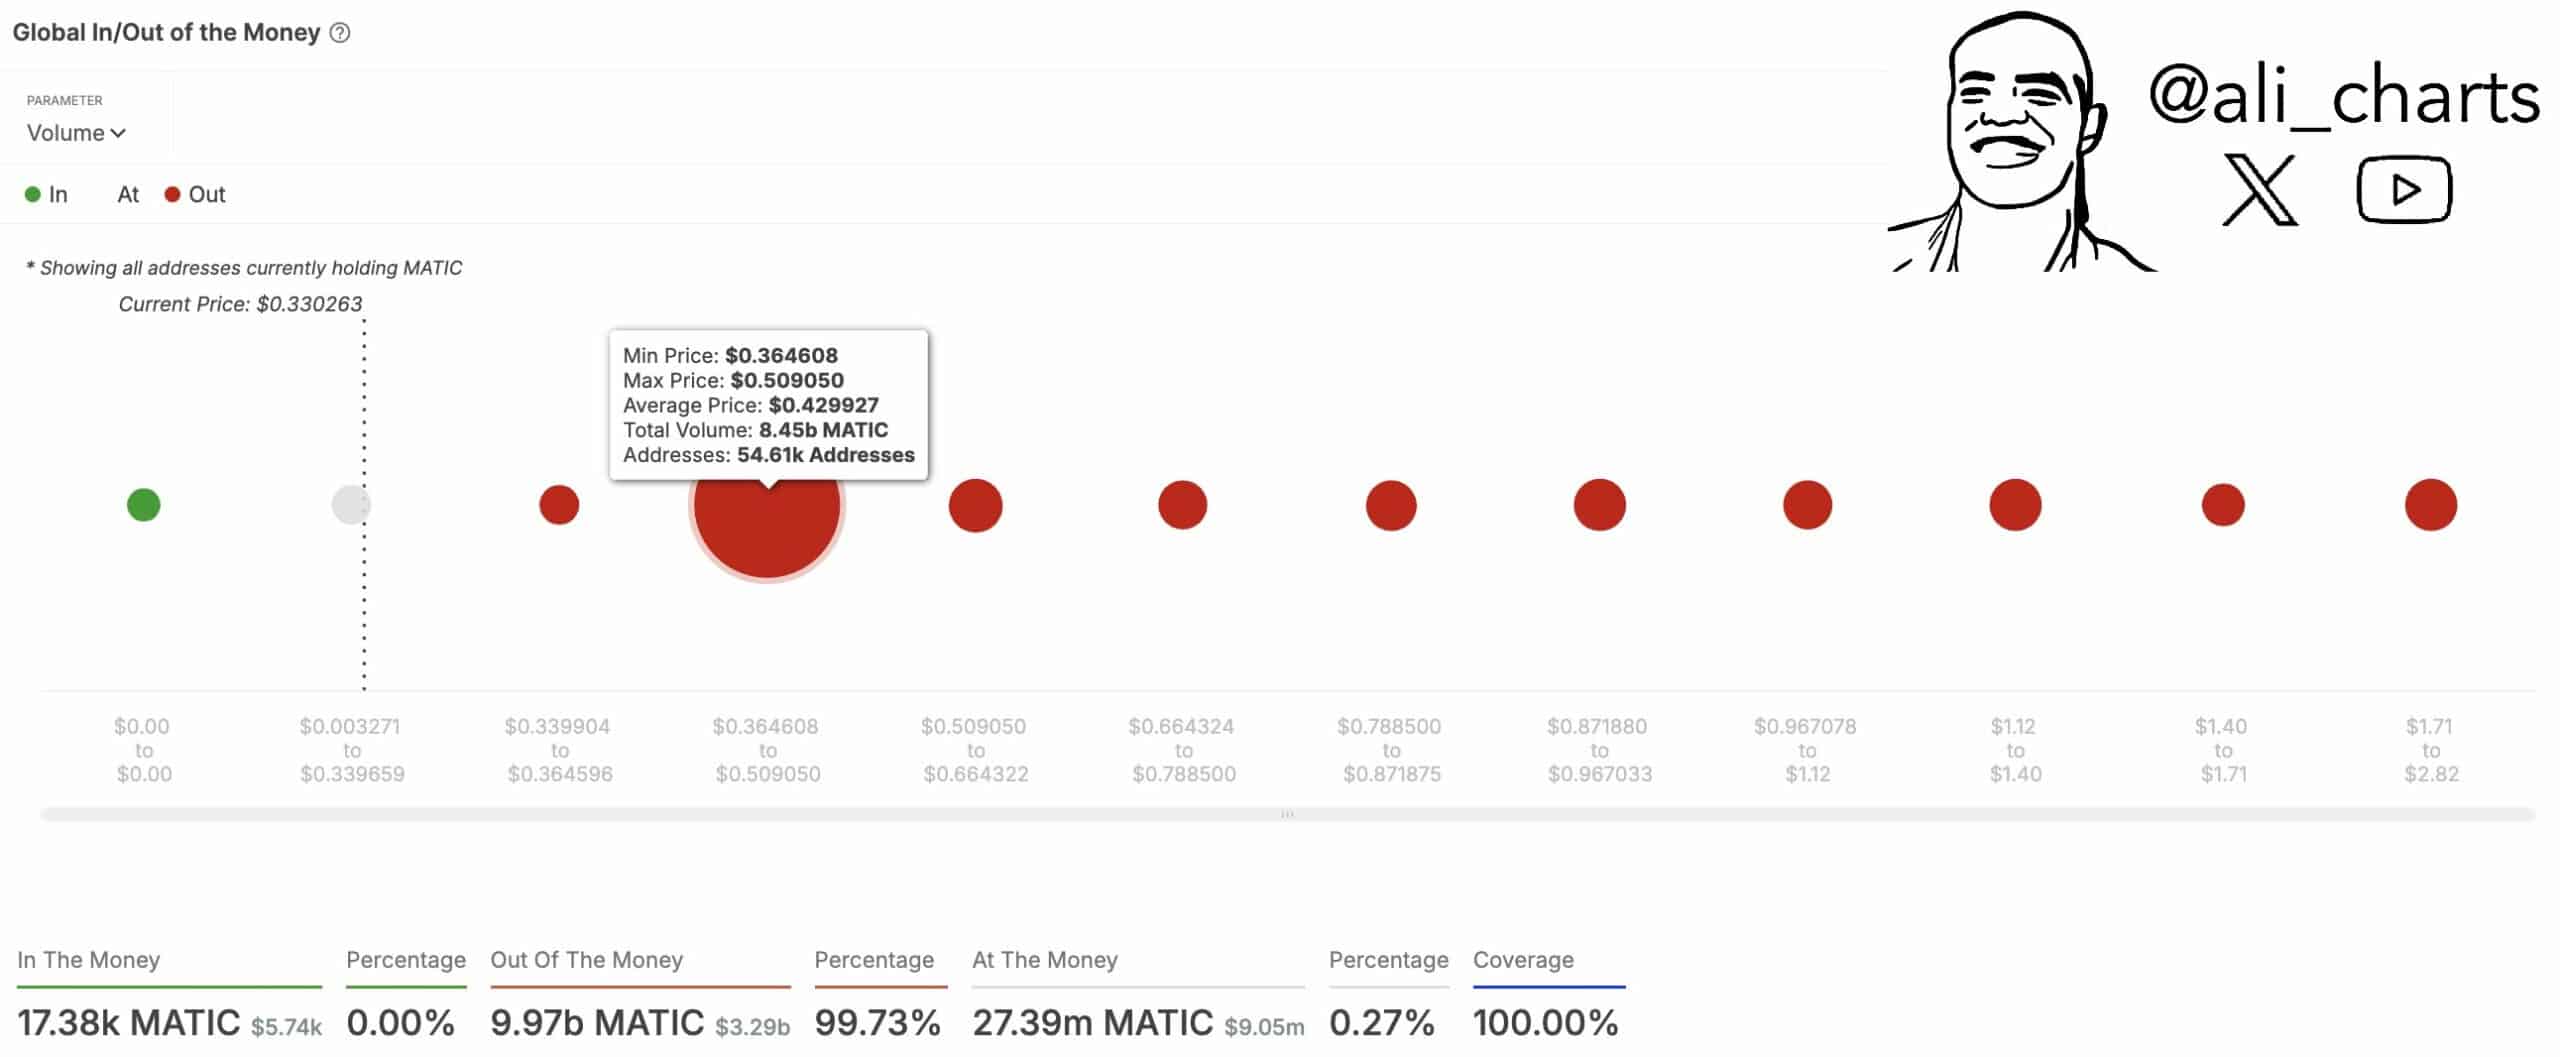
Source: IntoTheBlock
Conversely, failure to establish this zone as support may heighten the risk of further declines. Holders who entered at higher prices may opt to cut losses, leading to greater selling pressure. This dynamic can exacerbate POL price drops, creating a feedback loop that drives the price further away from the accumulated range.
As POL navigates the market, its ability to either consolidate above or falter below this range could be telling of the overall direction in the near term.
POL’s price action and prediction
The POL/USDT pair revealed a pattern following a liquidity sweep, as indicated by a sharp volume hike and a brief price surge. Subsequently, POL ascended, peaking at $0.515, before entering a downturn that intensified in late January 2025.
Its press time price trajectory placed POL just above the critical liquidity sweep level around $0.32, where it had previously rebounded. This level served as a key support zone. If POL maintains itself above this threshold, it could signal strength – Potentially catalyzing a rally.
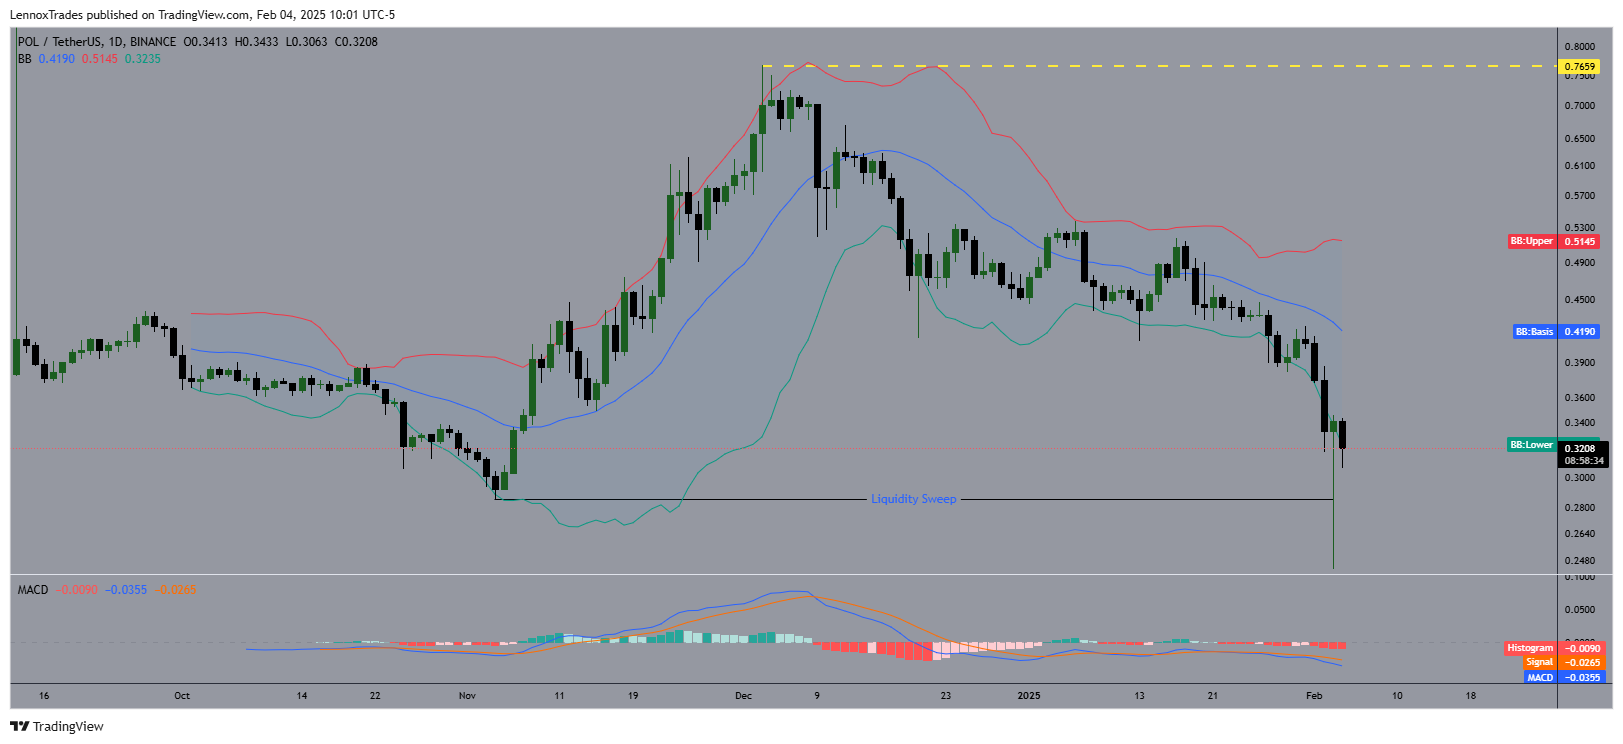
Source: Trading View
The presence of higher trading volume during the recent dip could suggest accumulation at these lower levels, hinting at possible upward movement.
Conversely, if POL fails to sustain this support level, it would risk a further decline. The MACD, in negative territory at press time, supported this cautious outlook – Indicating bearish momentum.
Should the price break below $0.32, the pathway to lower supports at $0.30 or even $0.28 would become increasingly likely. This could trigger a sell-off as traders look to mitigate losses.
Total active addresses
From mid-2019 to early 2025, the number of POL addresses climbed and steadily peaked in late 2021. Later, it flatlined before slightly declining through 2024.
During this period, the total address count and addresses with balances exhibited a correlation with the token’s price. It saw its highest peaks and sharpest declines in 2021 and 2022, respectively.
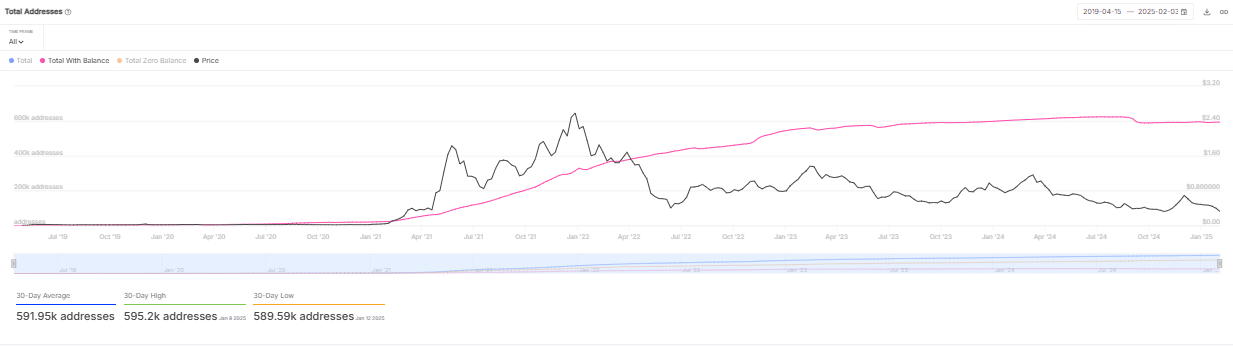
Source: IntoTheBlock
The total number of addresses with a balance was around 591.9k, having fallen from a 30-day high of 595.2k. This hinted at a slight fall in active participation.
If the number of active addresses continues to stabilize or grow, it could mean renewed investor interest and potentially support a price recovery. A further decline in active addresses may allude to the continuation of the prevailing bearish trend.