
- LINK battled key support at $22.85—holding above could trigger a rally toward $25 and beyond.
- MACD and RSI showed mixed signals, while declining Open Interest hinted at a potential market consolidation.
Chainlink [LINK] was trading at $23.48 at the time of writing, with a 24-hour trading volume of $729.94 million. The price has declined 1.89% in the past 24 hours and 9.29% over the past week, placing the token near the 0.382 Fibonacci retracement level at $22.85.
This level has emerged as a crucial support zone, where buyers appear to be stepping in to prevent further declines.
Technical analysis shows that holding above this level could provide a base for an upward movement. A potential rebound could push LINK toward the 0.5 Fibonacci level at $23.90, serving as an intermediate resistance.
Beyond this, the 0.618 Fibonacci retracement level at $25.00 could act as a key zone for trend reversals or breakouts.
Support and resistance levels define the next move
The current consolidation near $22.85 suggests this support is critical for LINK’s short-term price action.
A breakdown below this zone could see the token testing lower support near $22.00, where historical buying activity has been observed.
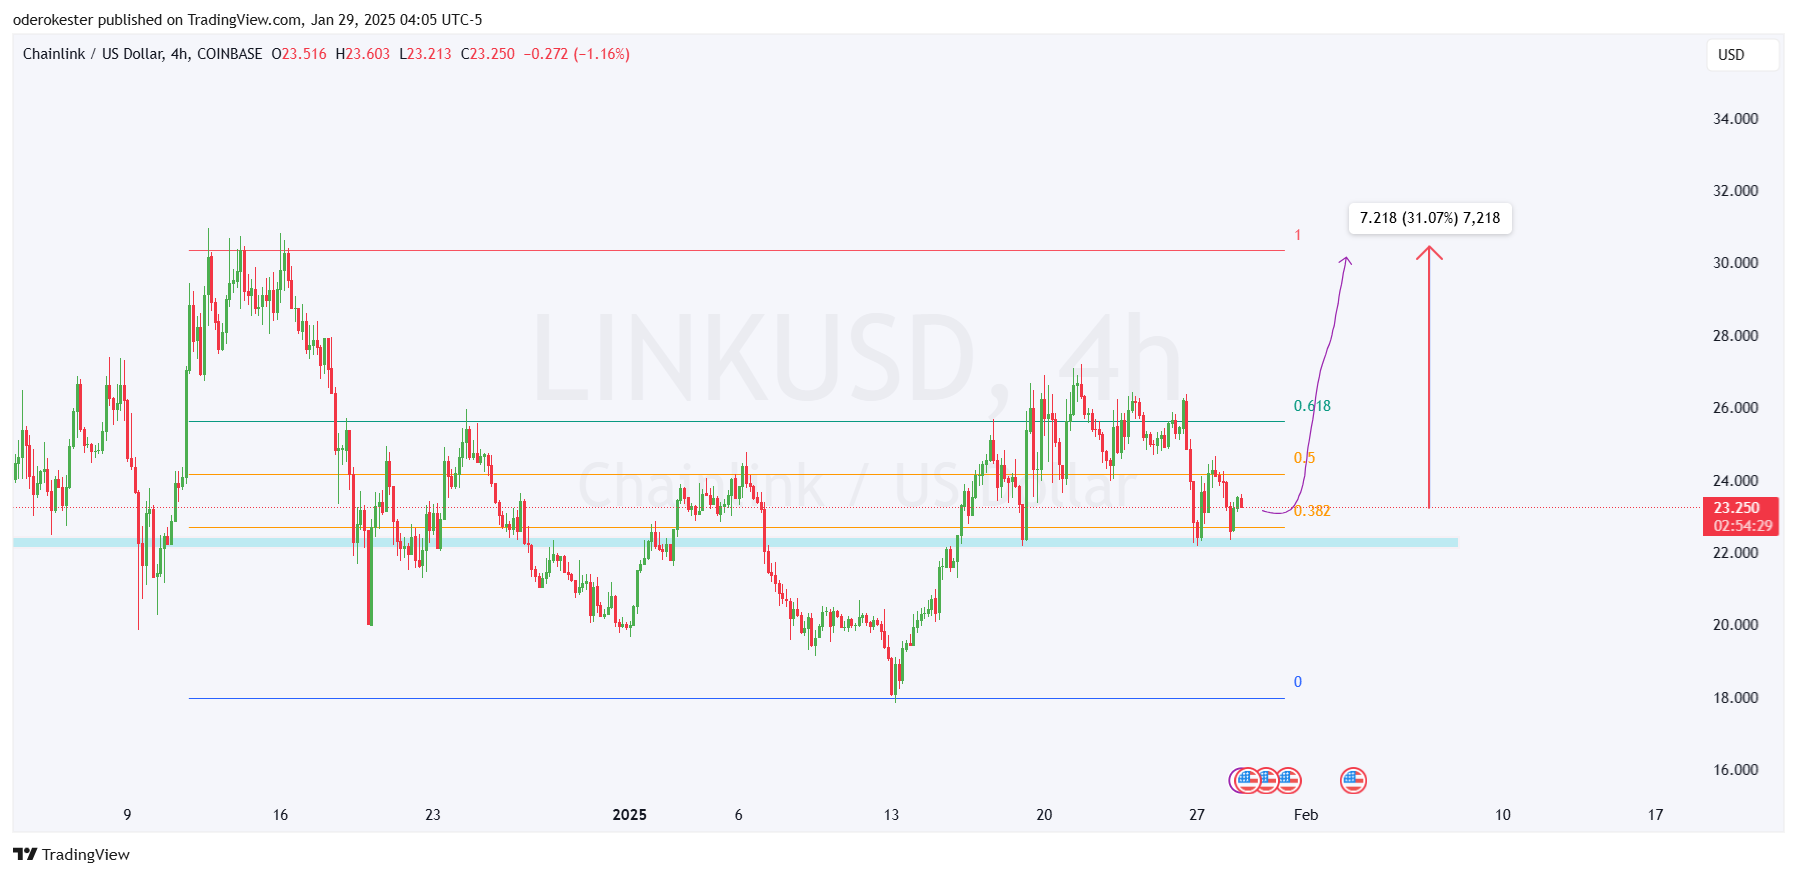
Source: TradingView
On the upside, immediate resistance lies at $23.90, with stronger resistance at $25.00. I
f LINK successfully breaks through these levels, the price could rally toward $30.46, representing a potential 31.07% gain from current levels.
Indicators signal mixed momentum
The Parabolic SAR indicates a shift to bullish momentum, as the dots have recently moved below the price. However, for sustained upward movement, LINK needs to surpass the key resistance near $27.00, the last recorded SAR dot level.
The MACD shows slight bullish momentum, with the MACD line at 0.485 above the signal line at 0.606. However, the declining green histogram bars suggest weakening strength.
A potential crossover of the MACD line below the signal line could indicate bearish pressure, prompting traders to watch this indicator closely.

Source: TradingView
Meanwhile, the RSI is at 49.65, reflecting neutral market conditions. A move above 50 could signal increased buying momentum, while a decline below 40 may lead to a bearish continuation.
On-Chain data and market participation
According to CryptoQuant data, Chainlink’s total transaction count is trending at 11K, reflecting moderate network activity compared to previous peaks.
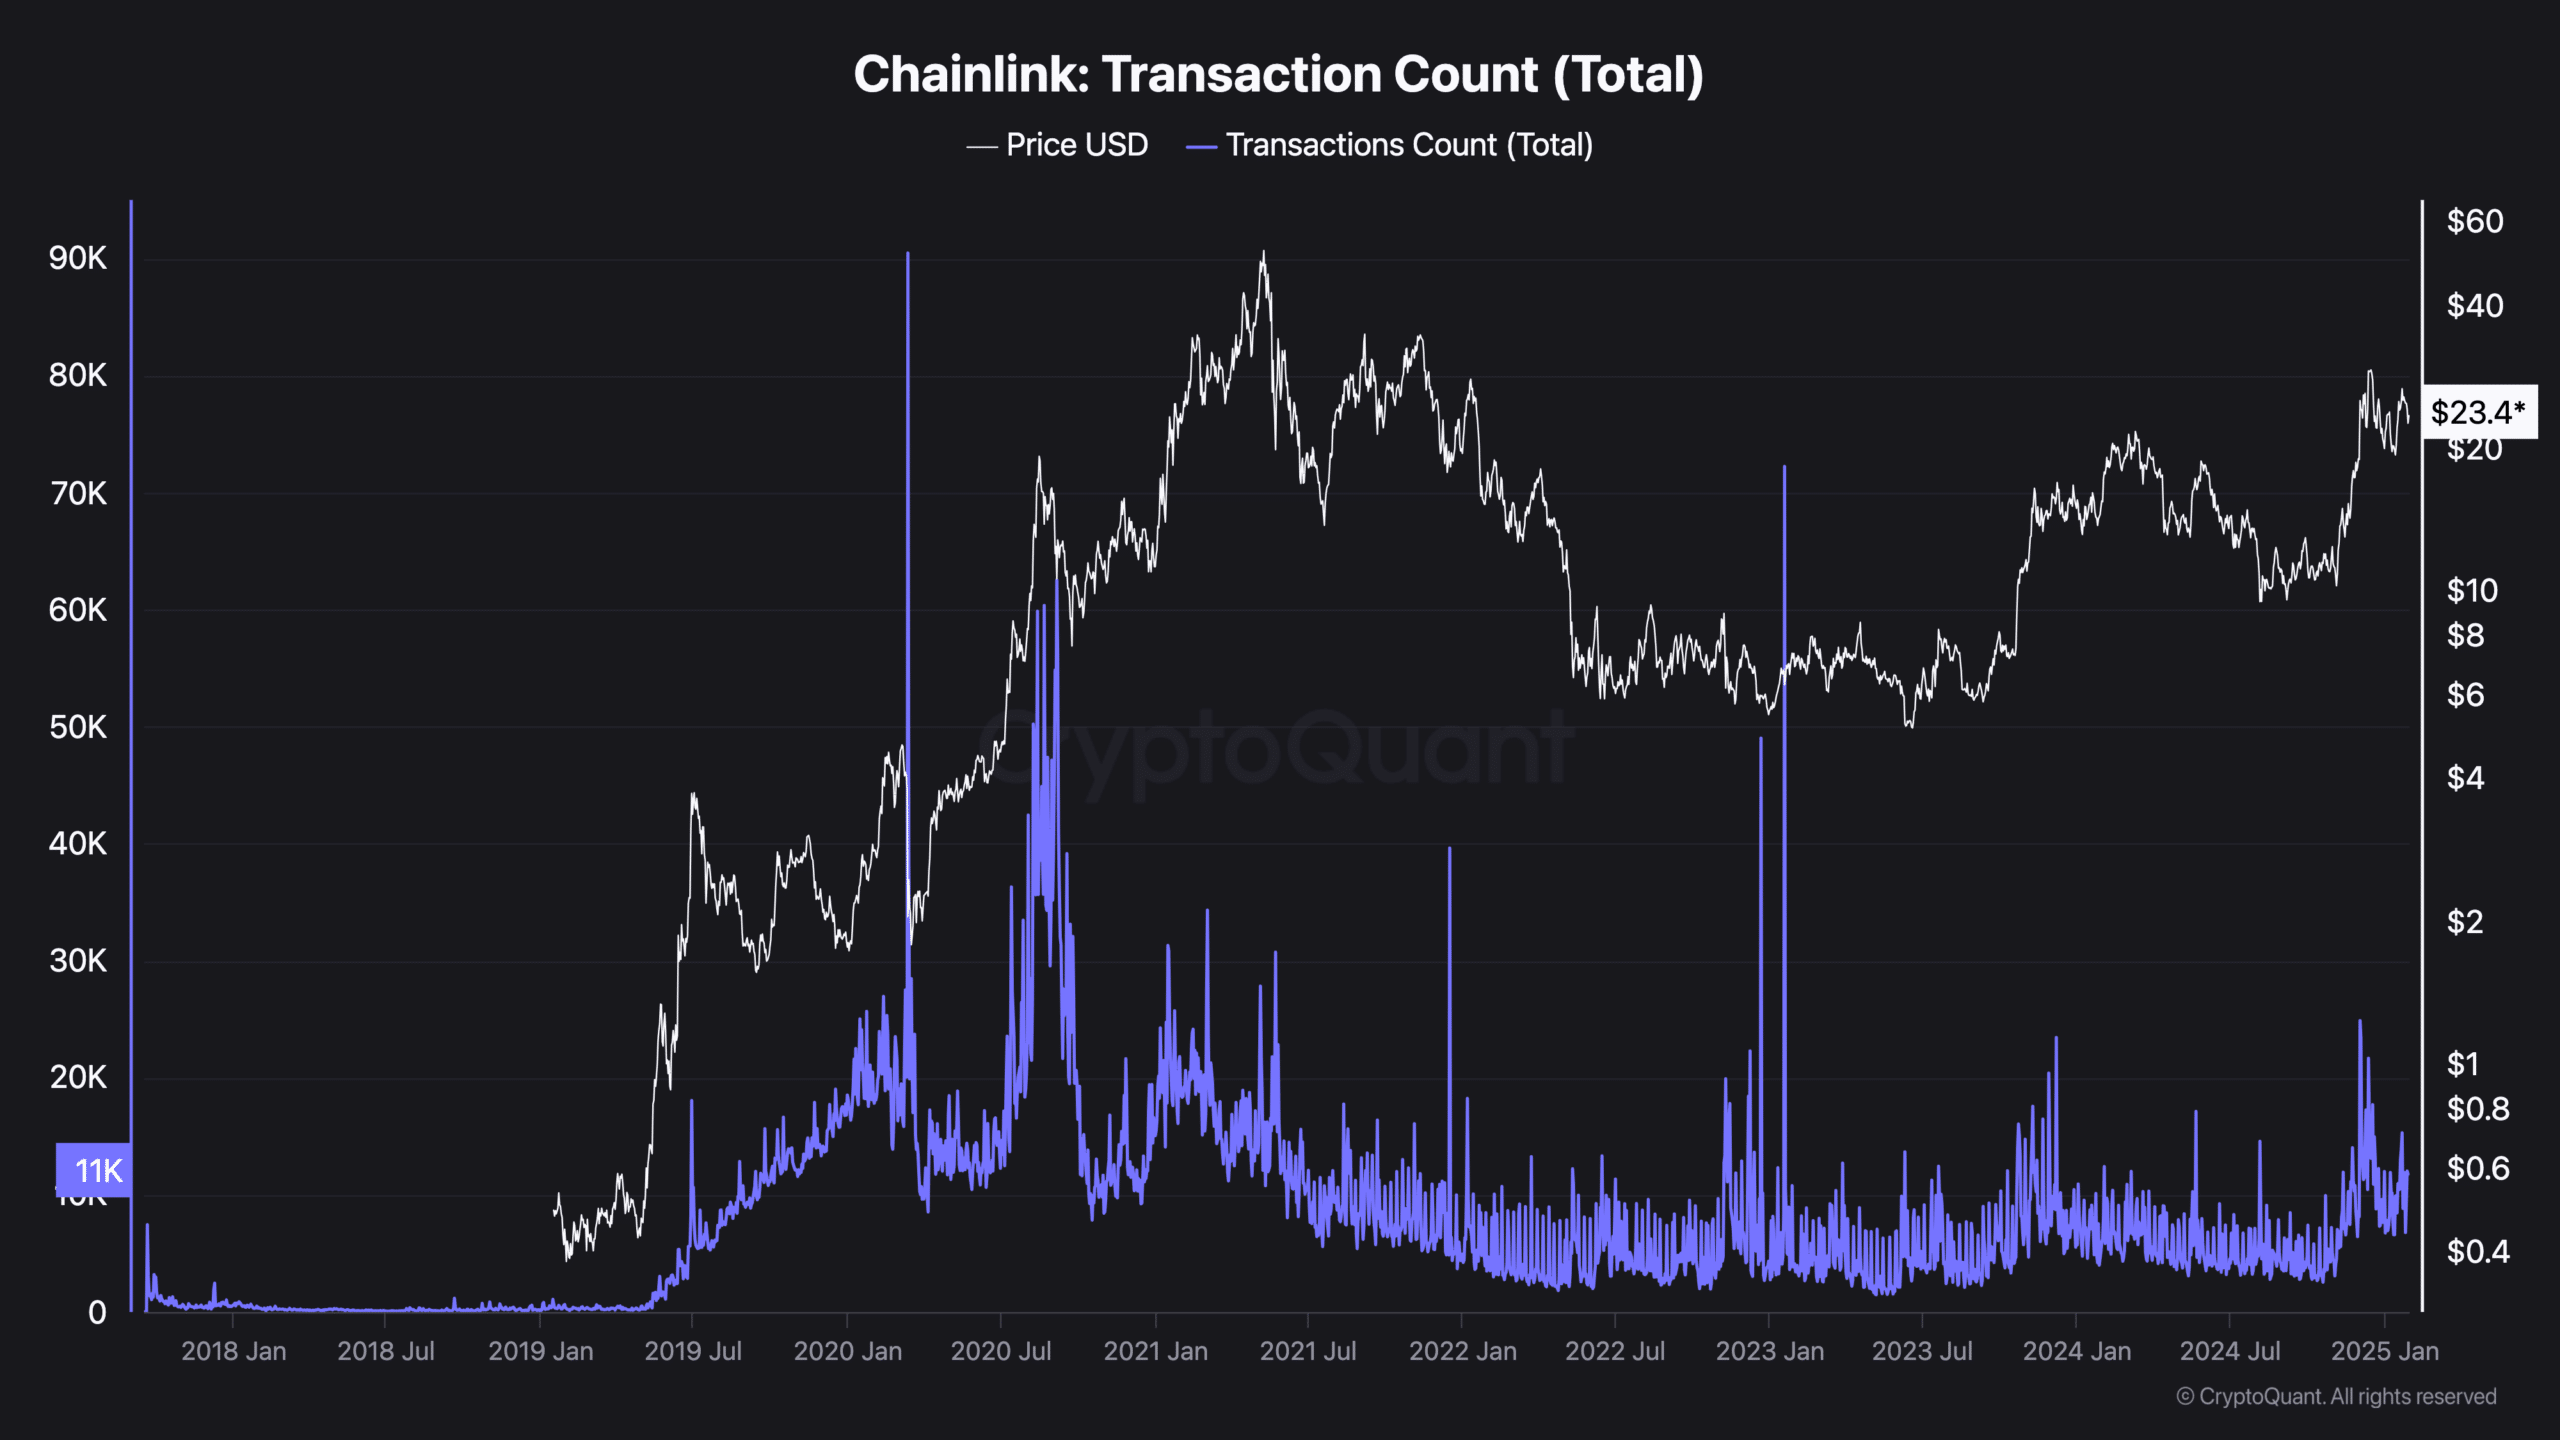
Source: CryptoQuant
Transaction spikes in 2020 and 2021, when LINK prices neared $60, suggest that higher on-chain activity typically aligns with bullish rallies.
Read Chainlink’s [LINK] Price Prediction 2025–2026
Additionally, Coinalyze data shows that the Open Interest (OI) was at $384.5 million, with a 5.68% decline in the past 24 hours. This reduction in active positions indicates decreased market participation and potential consolidation.
Traders are monitoring OI changes closely, as they often precede significant price movements.
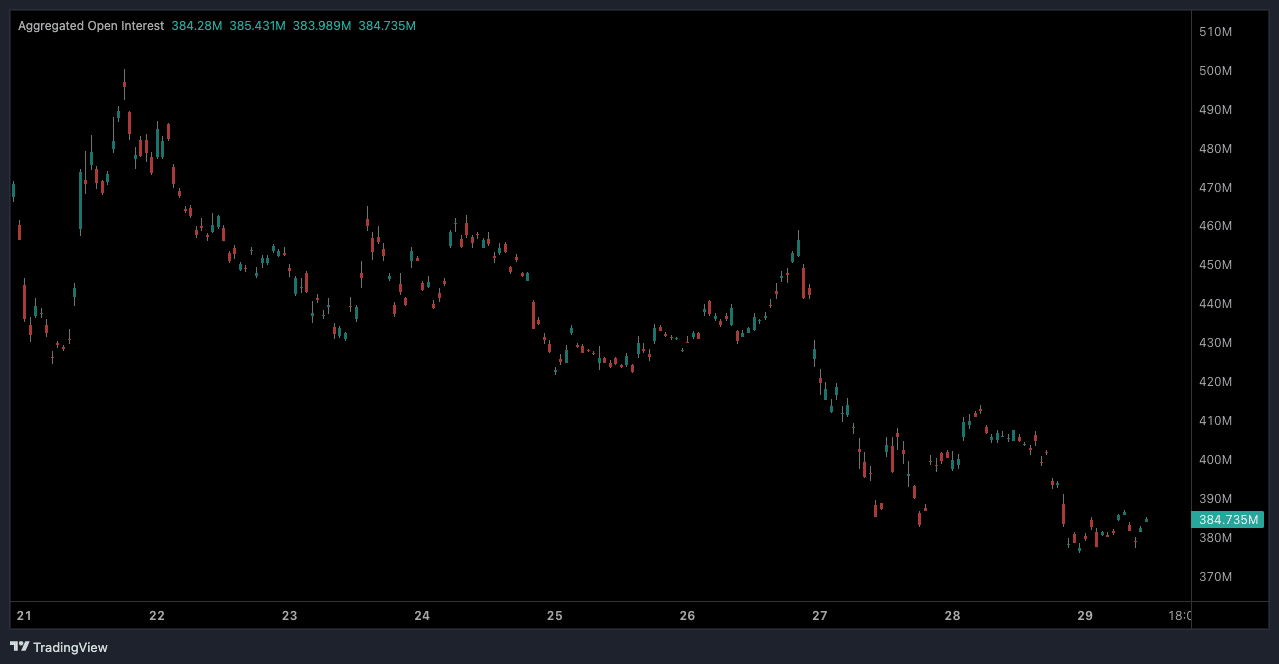
Source: Coinalyze
At the time of writing, LINK’s price was testing a critical support level that could act as a springboard for recovery.