
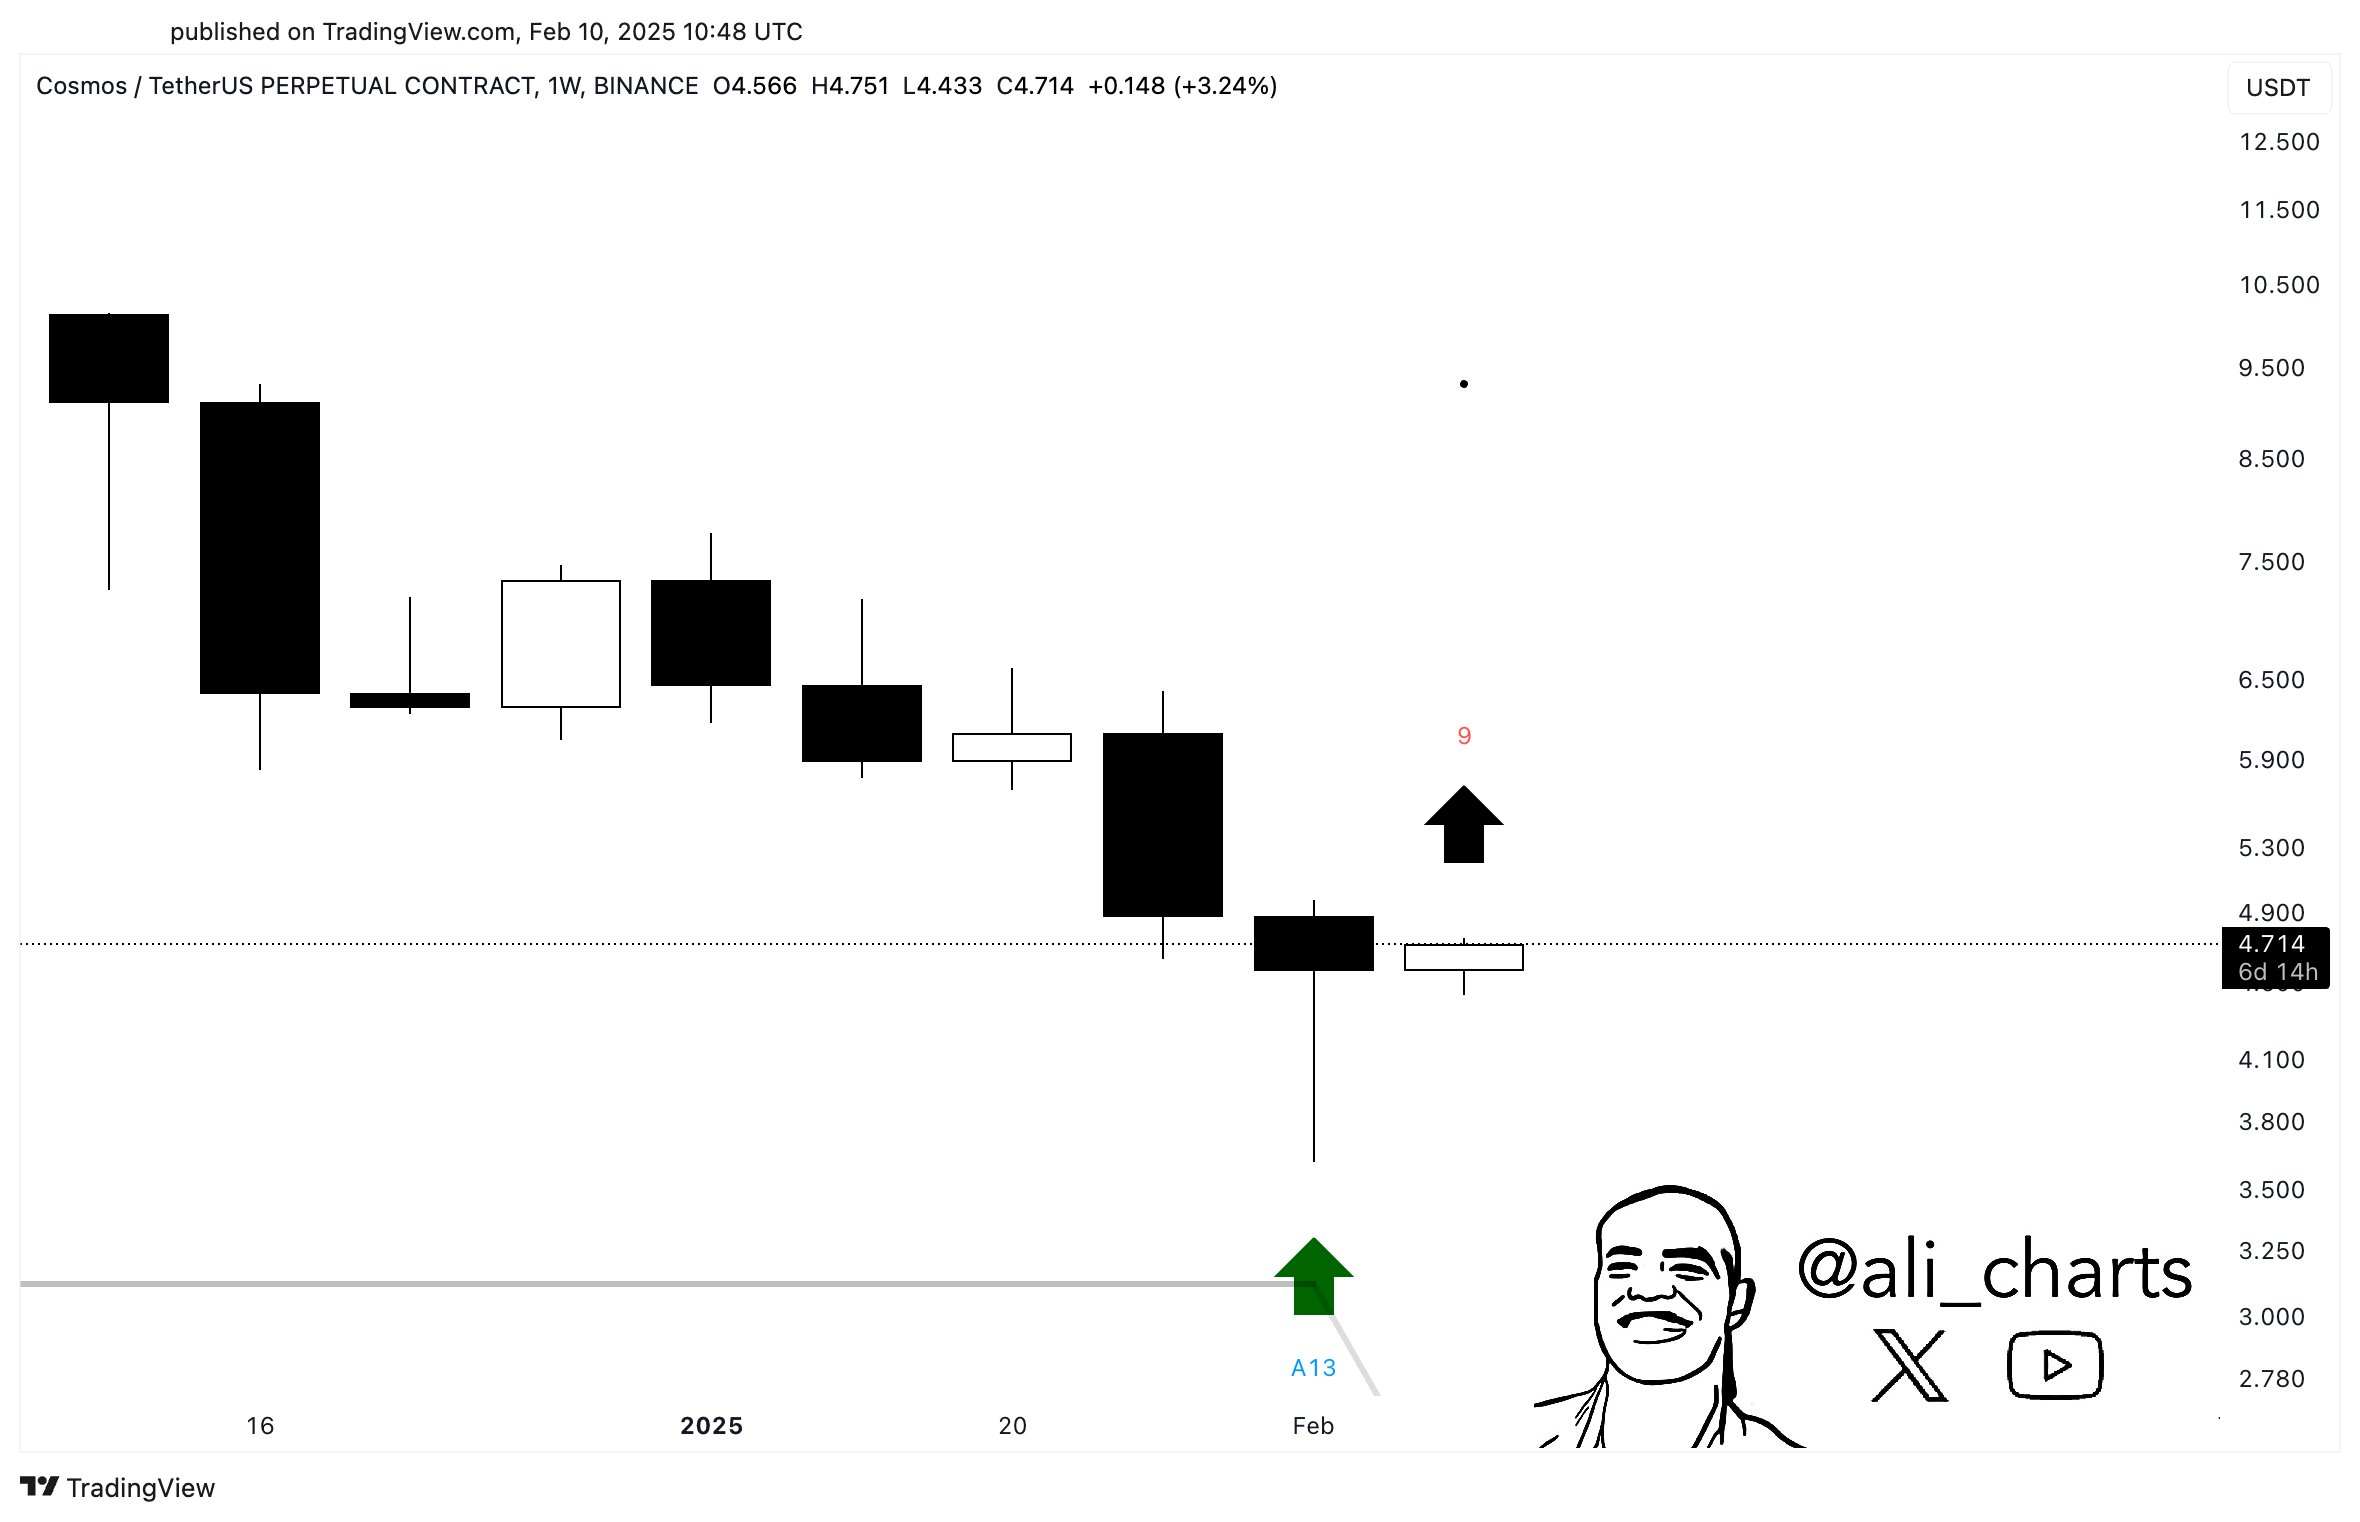
- ATOM may be showing signs of a potential rebound as the TD Sequential indicator flashed a buy signal on the weekly chart
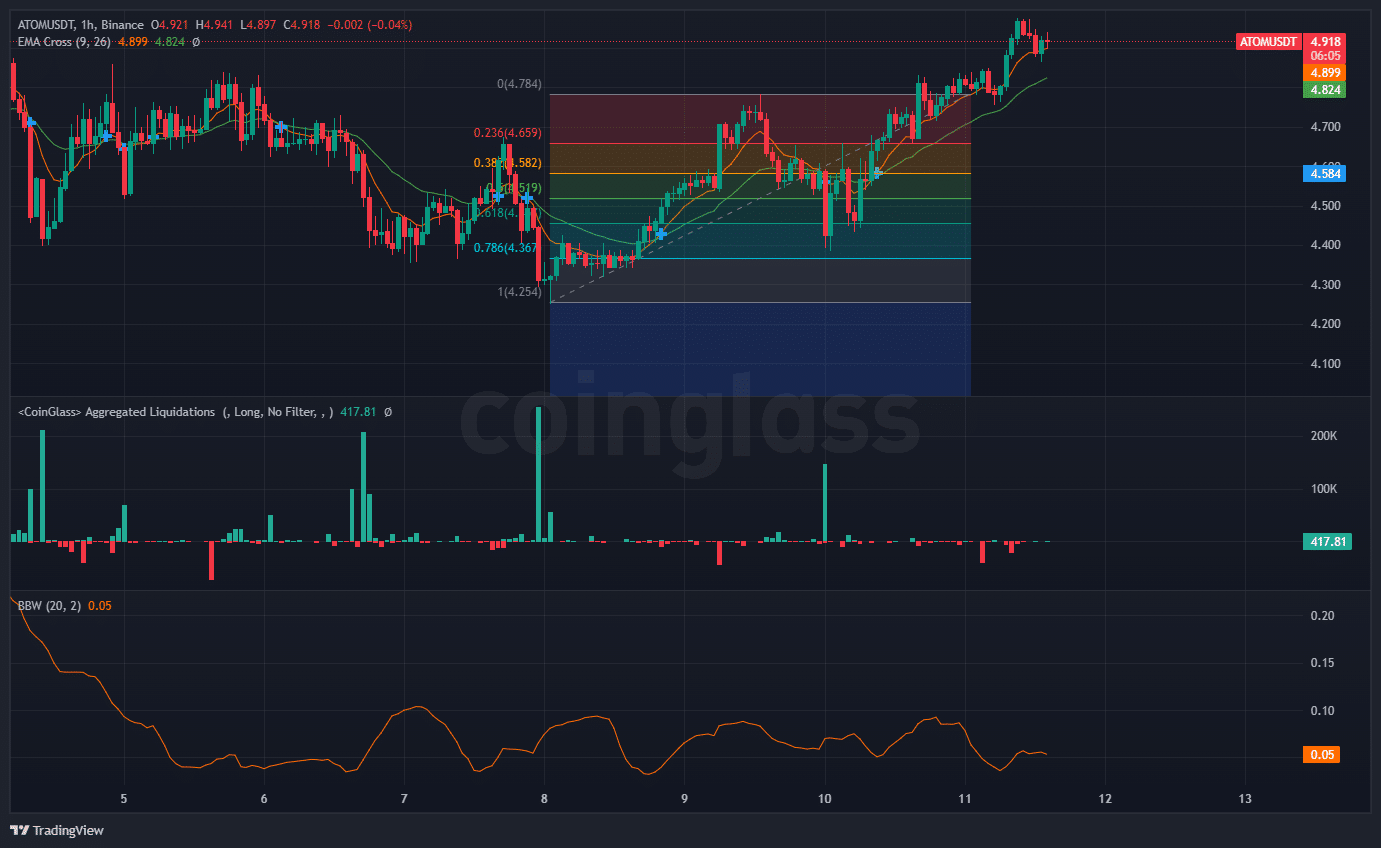
- ATOM’s price retraced close to the 0.618 (61.8%) Fibonacci level
Identifying potential rebounds and trend reversals is essential for profitability. In fact, just recently, Cosmos (ATOM) exhibited signs of a possible recovery, as indicated by the TD Sequential buy signal on the weekly charts.
Traders brace for a potential surge
AMBCrypto’s latest analysis revealed a significant downtrend on ATOM’s charts, followed by consolidation and a transition into an uptrend.
Fibonacci retracement levels play a crucial role in identifying support and resistance zones. ATOM’s price retraced to approximately the 0.618 (61.8%) Fibonacci level, a common point for reversals. This, coupled with the recent upward movement, hinted at strong support at this level – Increasing the likelihood of a rebound.
Source: TradingView
Additionally, the Exponential Moving Average’s (EMA) crossover further strengthend this bullish outlook. The 9-period EMA crossed above the 26-period EMA – A sign of increasing upward momentum.
Such a crossover typically means a potential price hike, reinforcing the hypothesis that ATOM may continue its upward trajectory.
Buying pressure strengthens as Optimism grows
The TD Sequential indicator flashed a buy signal on ATOM’s weekly chart. In fact, this indicator predicted trend exhaustion and potential reversals for the altcoin.
Source: X
A buy signal at this stage means that ATOM has reached a point where selling pressure has diminished, making way for a possible price surge. The alignment of this signal with other technical indicators can be further used to validate the bullish sentiment surrounding ATOM.
Market signals indicate a shift in momentum
Here, it’s also worth analyzing aggregated liquidations since they provide insight into potential short-term price movements. The chart revealed notable spikes in long liquidations around the 0.22% and 0.26% levels.
Such spikes often indicate that traders have been forced out of their positions, leading to temporary selling pressure, followed by price recoveries.
At the time of writing, the liquidation level stood at 417.81 – Relatively low compared to previous spikes. This suggested that the market is not facing significant selling pressure from liquidations at this moment, reducing the likelihood of a further decline and supporting the case for a smoother price hike.
ATOM gearing up for a potential breakout
Finally, the Bollinger Bands, a key volatility indicator, provided further confirmation of a potential price rebound. ATOM, at press time, was close to the lower Bollinger Band – A level that often acts as a support level.
Such a positioning suggested that the price might bounce back. Additionally, the Bollinger Bandwidth (BW) indicator was at 0.05, indicating low volatility. Historically, periods of low volatility are followed by significant price movements, implying that an expansion in volatility could result in an upward breakout.
To put it simply, technical indicators suggested that ATOM may be positioned for a potential rebound now.