
Bitcoin fell to an intraday low of $117,914 today as $47.5 million in liquidations hit the market. However, the broader bullish structure still remains intact.
Summary
- Bitcoin dipped to $117,914 amid $47.5 million in liquidations.
- The flagship crypto has struggled to break past $119k multiple times.
- Bitcoin’s market dominance has declined by 4.98% over the past month.
Why did BTC price dip today?
Bitcoin’s price dipped today as it entered a high-liquidity zone between $118K and $119K, packed with leveraged long positions, that is, big bets placed by traders expecting the rally to continue.
Many of these were entered hastily, without clear confirmation, likely driven by FOMO after BTC’s sharp run from $115K to nearly $120K last week.
When the price failed to break higher and instead slipped into this zone, those long positions began getting liquidated automatically, triggering a wave of forced selling that pushed the price lower.
According to 24-hour liquidation heatmap data from CoinGlass, if downside pressure continues, Bitcoin could slide deeper into the $118K range, where another cluster of vulnerable long positions remains exposed.
When writing, BTC bulls were trying to reclaim $119,000 after failing to breach this resistance zone multiple times over the past weeks.
Per the liquidation heatmap, a dense cluster of short positions is concentrated between $120,000 and $120,600, creating a strong resistance zone that has repeatedly capped BTC’s upward moves in recent weeks.
Each intraday attempt to reclaim $119K has been met with sharp sell pressure, likely due to automated liquidations and short re-entries.
Some of the recent selling pressure is also due to profit-taking by early investors and intraday traders, especially as BTC continues to trade near its all-time high of $122,838, and over 61% above its April lows.
At the same time, market momentum appears to be rotating away from Bitcoin toward Ethereum and the broader altcoin market. Bitcoin’s market dominance has dropped 4.98% over the past month, while Ethereum’s market share has increased by 2.98% in the same period.
Ether has posted stronger relative gains in recent sessions, supported by a sharp uptick in demand for spot ETH ETFs, which saw inflows of over $1.8 billion this week, compared to just $72 million for Bitcoin.
This capital rotation has also spilled over into high-beta altcoins like Solana, Avalanche, and Chainlink, as traders seek higher volatility plays amid Bitcoin’s stalled breakout attempts.
Is the Bitcoin bull run over?
According to CryptoQuant analysts, Bitcoin could still have some room to run before it hits a cycle top.
In a July 28 analysis, CryptoQuant contributor Yonsei Dent pointed out that Bitcoin’s MVRV ratio, which compares its current market price to the average cost basis of all coins, is approaching levels that previously marked major tops.
The 365-day moving average of this ratio is forming a double-top pattern, similar to what was seen in the 2021 bull cycle, where the second peak closely aligned with the market top.
While the second MVRV peak may land in September if the pattern holds, Dent cautioned the market could see a reversal as early as late August.
“In short, we’re entering a zone where optimism and caution must coexist,” Dent wrote.
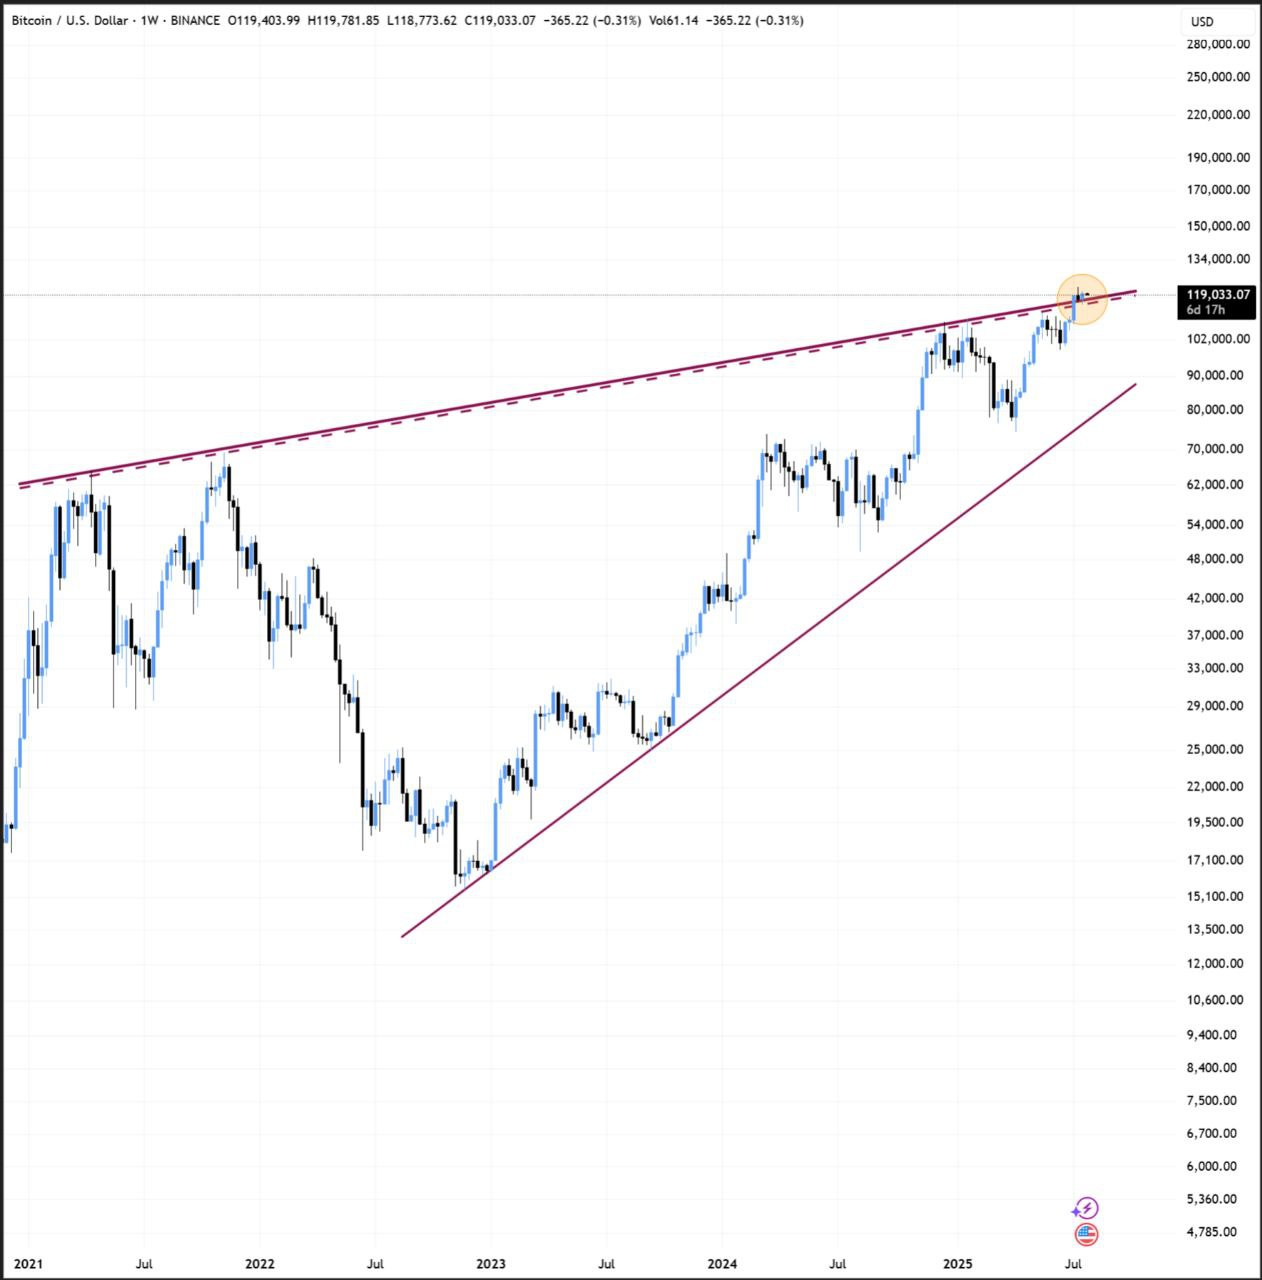
For the BTC rally to continue, analysts say a decisive break above the $119,500 resistance level is critical.
According to BitBull, Bitcoin is currently testing a long-term trendline, and a confirmed weekly close above $119,500 could trigger a subsequent rally toward $135,000 in the coming weeks.
This momentum may be supported by improving macroeconomic sentiment as the U.S. reaches new stages of trade negotiations with key partners.
Meanwhile, any dovish tone from the Federal Reserve, which is set to meet this Wednesday, or signs of potential rate cuts later this year, could boost risk sentiment and provide short-term upside for Bitcoin.
Disclosure: This article does not represent investment advice. The content and materials featured on this page are for educational purposes only.