After briefly retreating to $90,000 earlier in the week, Bitcoin has rebounded strongly, climbing above the $95,000 price.
Currently trading at $95,224, Bitcoin has recorded a 7% gain over the past two weeks, signaling renewed bullish momentum.
Related Reading
Key Indicators Highlight Best Buying Opportunities
As Bitcoin continues its rally, CryptoQuant, a prominent on-chain analytics platform, has shared insights into key metrics that could help potential investors determine optimal entry points.
Drawing on historical data and market behaviour, CryptoQuant highlights the patterns of price corrections, short-term holder strategies, speculative bets, and trading volume indicators to guide investors in navigating Bitcoin’s ongoing bull run.
According to CryptoQuant, historical bull markets have shown that price drawdowns are inevitable, even during periods of sustained growth.
For instance, the 2017 bull market experienced corrections of up to 22%, while the 2021 rally saw 10% and 30% declines. The 2024 bull run has already seen 15% and 20% price pullbacks, suggesting that periodic corrections may offer strategic buying opportunities.
The platform also emphasizes the significance of the Short-Term Holder Realized Price metric, which reflects the average cost basis of recent investors. This metric often serves as a critical support level during bull markets, as short-term holders are more likely to buy at their break-even price, reinforcing price stability.
Buy at the Average Cost Basis of Short-Term Holders
The Short-Term Holder Realized Price can be seen as the buy-the-dip level during bull markets.
Investors tend to buy at their break-even price, making this indicator a visualization of price support. pic.twitter.com/mTDpuhaK8Y
— CryptoQuant.com (@cryptoquant_com) November 27, 2024
Additionally, CryptoQuant points to the “Flush of Open Interest,” a phenomenon where speculative positions are cleared out during periods of heightened price action. This process can create favorable entry points for investors looking to capitalize on temporary market resets.
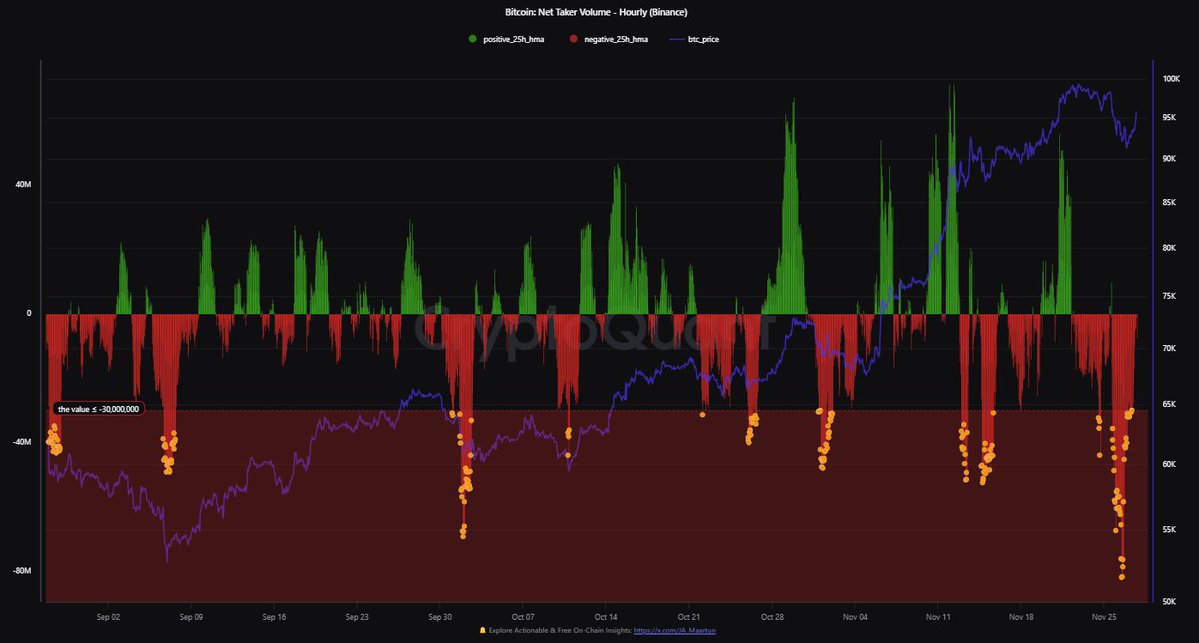
Lastly, the Net Taker Volume indicator, which measures the balance between buying and selling pressure, suggests that peak selling activity can signal opportunities for future price growth.
A reading below -$30,000,000 according to CryptoQuant, as seen recently, may indicate that sellers are nearing exhaustion, paving the way for potential upside.

Key Support Levels For Bitcoin
While Bitcoin’s current momentum hints at another potential rally, analysts caution the importance of maintaining critical support levels. Crypto analyst Ali recently identified the $93,580 price zone as a key demand level, where approximately 667,000 addresses collectively acquired nearly 504,000 BTC.
Related Reading
According to the analyst, remaining above this level is crucial to avoid a potential sell-off from holders at this price point.
One key demand zone for #Bitcoin to watch is $93,580, where 667,000 addresses bought nearly 504,000 $BTC. Staying above this support level is a must to prevent these holders from selling! pic.twitter.com/UdXTZOYzGH
— Ali (@ali_charts) November 28, 2024
Featured image created with DALL-E, Chart from TradingView

