Close Menu
    What's Hot

    Ethereum Eye Potential Parabolic Upsurge – Here’s The Short-Term Target

    World Experience: Updates from the Next Billion Fellowship

    Ethereum ETF Frenzy: Inflows Jump 5x While Bitcoin Stalls

    Facebook X (Twitter) Instagram
    yeek.io
    • Crypto Chart
    • Crypto Price Chart
    X (Twitter) Instagram TikTok
    Trending Topics:
    • Altcoin
    • Bitcoin
    • Blockchain
    • Crypto News
    • DeFi
    • Ethereum
    • Meme Coins
    • NFTs
    • Web 3
    yeek.io
    • Altcoin
    • Bitcoin
    • Blockchain
    • Crypto News
    • DeFi
    • Ethereum
    • Meme Coins
    • NFTs
    • Web 3
    Meme Coins

    Is SHIB’s bearish run over? Watch for a potential reversal near $0.0000114!

    Yeek.ioBy Yeek.ioJune 16, 2025No Comments3 Mins Read
    Share Facebook Twitter Pinterest Copy Link Telegram LinkedIn Tumblr Email
    Share
    Facebook Twitter LinkedIn Pinterest Email
    • Shiba Inu’s price structure was bearish, with the local lows emerging as attractive short-term price targets
    • A divergence or reversal signal on the lower timeframes, combined with greater demand, might be necessary for a trend reversal

    Since March, Shiba Inu [SHIB] has traded within a range that reached from $0.0000115 to $0.0000142. After recording a successful breakout in the first half of May, the memecoin fell below the $0.0000152 support. In doing so, it formed a descending triangle pattern.

    An analysis from AMBCrypto pointed out that this pattern would likely be accompanied by a downward price move. This has come to pass, and the lows of the range have been tested. Where is SHIB likely to go next?

    Shiba Inu to sink towards the next cluster of liquidation levels?

    Shiba Inu 1-day Chart

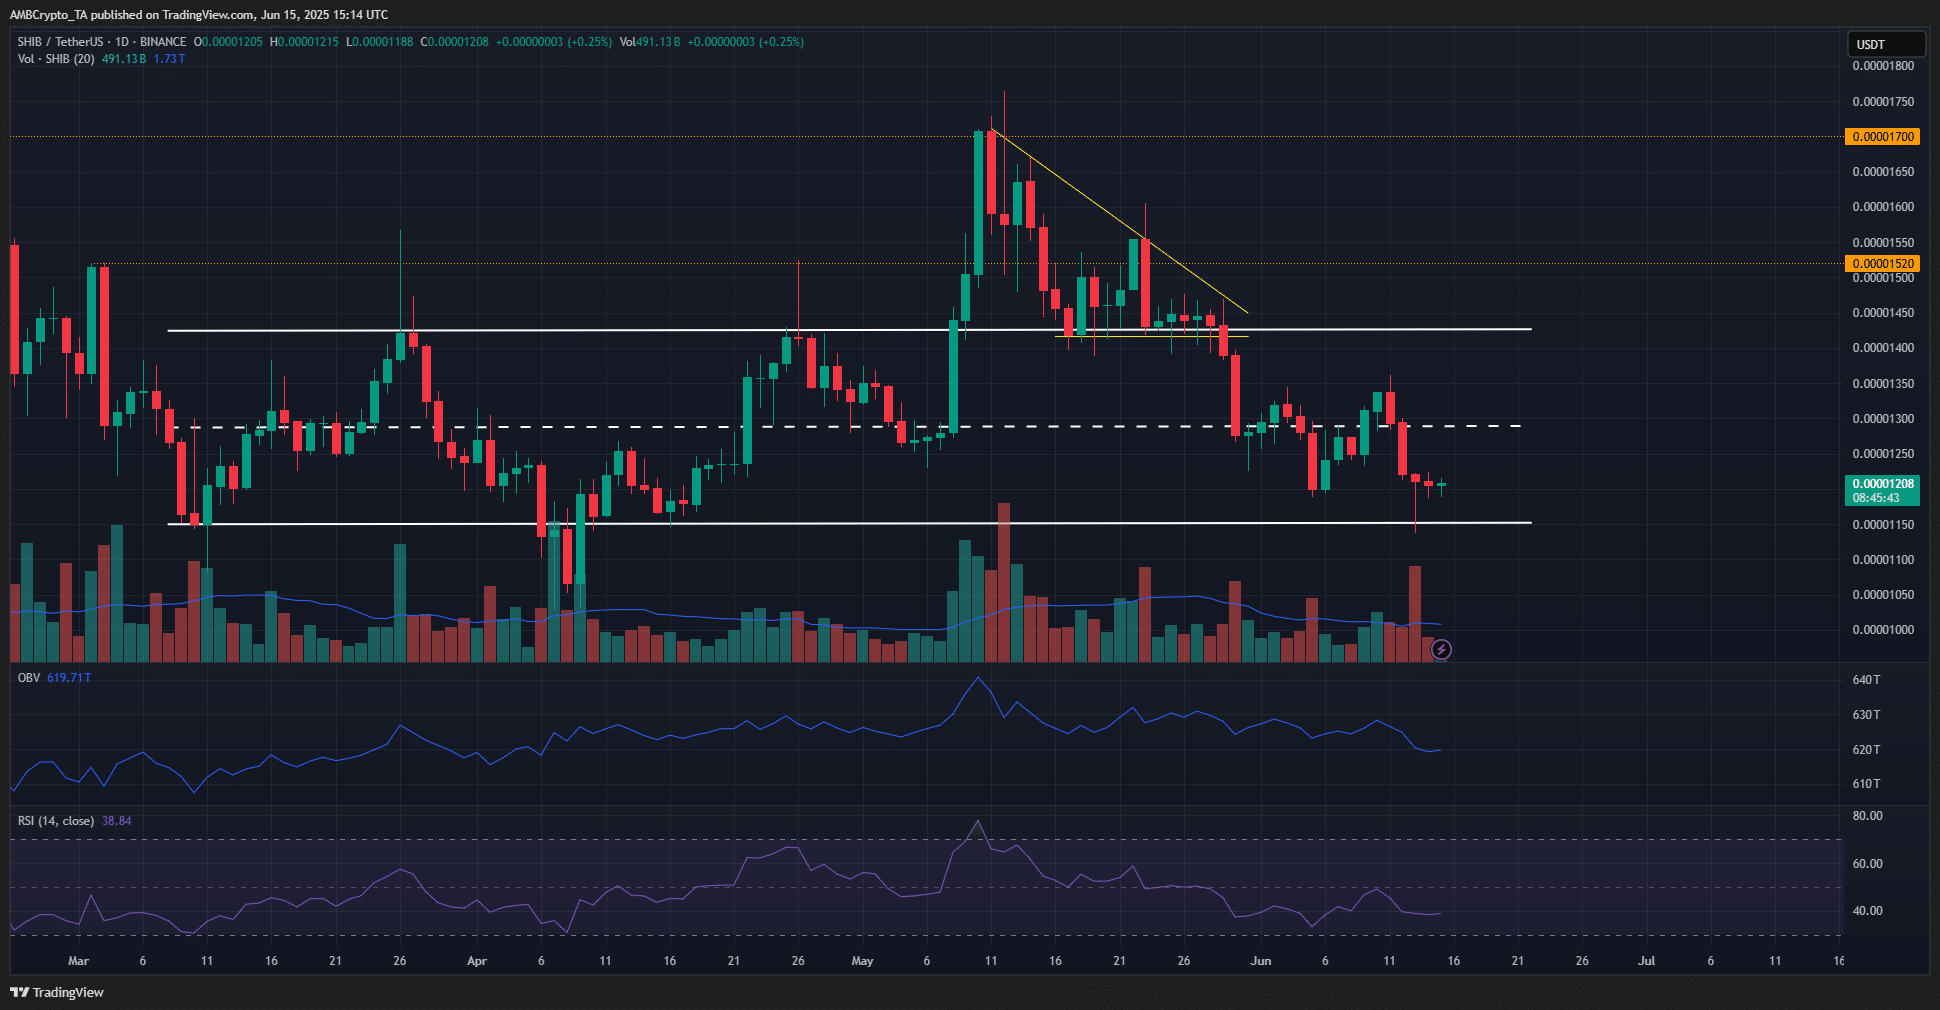
    Source: SHIB/USDT on TradingView

    The picture from the technical analysis was not bright or bullish for SHIB bulls. After losing the $0.0000152-level as support, it retested the same as resistance, demarcating a supply zone. The market structure has been bearish since late May, and this has not changed.

    The RSI has been below neutral 50 over the past three weeks, confirming the structural diagnosis. The OBV has also been trending southbound since late May – A sign of greater selling volume.

    On Friday, 13 June, Shiba Inu fell as low as $0.0000114. At press time, the local support at $0.000012 was being defended. This might change in the next 24-48 hours. The downward wick made last Friday seemed highly likely to be tested soon.

    Shiba Inu Liquidation HeatmapShiba Inu Liquidation Heatmap

    Source: Coinglass

    The liquidation heatmap with a 3-month lookback period agreed with this statement. It revealed two clusters of liquidity near the price. The one further away from the price was at $0.0000136. The closer magnetic zone sat at $0.0000114, the low from Friday.

    The bunched up liquidation levels around and just below the local low would likely to be visited soon, but this may not be a guarantee. At the same time, a bullish reversal from the range lows should not be taken for granted either. This, because of the declining OBV.

    Traders can keep an eye on the $0.0000110-$0.0000114 area for a bullish reversal in the lower timeframe charts, or a bullish divergence to show itself in the coming days. This could be the cue for going long. Until then, the short-term bias can remain bearish.

    Disclaimer: The information presented does not constitute financial, investment, trading, or other types of advice and is solely the writer’s opinion

    Previous: Bitcoin traders are shorting BTC at its peak – Here’s why that’s risky!
    Next: AAVE price prediction – A deeper retracement may be on the cards because…

    Follow on Google News Follow on Flipboard
    Share. Facebook Twitter Pinterest LinkedIn Tumblr Email Copy Link
    Previous ArticleBrazil ends crypto tax break, imposes 17.5% levy on gains
    Next Article Hong Kong accelerates stablecoin licensing to tap into global market boom
    Avatar
    Yeek.io
    • Website

    Yeek.io is your trusted source for the latest cryptocurrency news, market updates, and blockchain insights. Stay informed with real-time updates, expert analysis, and comprehensive guides to navigate the dynamic world of crypto.

    Related Posts

    Popcat surges 9% as buyers make a comeback

    June 16, 2025

    Memecoins to watch this week: PENGU, BONK, POPCAT

    June 16, 2025

    Dogecoin’s road to slow recovery – Here’s why investors should be ready for volatility!

    June 16, 2025
    Leave A Reply Cancel Reply

    Advertisement
    Demo
    Latest Posts

    Ethereum Eye Potential Parabolic Upsurge – Here’s The Short-Term Target

    World Experience: Updates from the Next Billion Fellowship

    Ethereum ETF Frenzy: Inflows Jump 5x While Bitcoin Stalls

    Ethereum Holds $2,500 Support – History Signals $4,000 As Potential Target

    Popular Posts
    Advertisement
    Demo
    X (Twitter) TikTok Instagram

    Categories

    • Altcoin
    • Bitcoin
    • Blockchain
    • Crypto News

    Categories

    • Defi
    • Ethereum
    • Meme Coins
    • Nfts

    Quick Links

    • Home
    • About
    • Contact
    • Privacy Policy

    Important Links

    • Crypto Chart
    • Crypto Price Chart
    © 2025 Yeek. All Copyright Reserved

    Type above and press Enter to search. Press Esc to cancel.