
On-chain data shows the Ethereum MVRV Ratio has seen a notable decline recently. Here’s what this could mean for the price, according to history.
Ethereum MVRV Ratio Has Fallen To A Relatively Low Level Recently
In a new post on X, the market intelligence platform IntoTheBlock has discussed about the latest trend in the Market Value to Realized Value (MVRV) Ratio of Ethereum. The MVRV Ratio refers to an on-chain metric that measures the ratio between the market cap and realized cap of ETH.
In short, what this indicator tells us is how the value held by the investors as a whole compares against the investment that they initially made to purchase their coins.
When the MVRV Ratio is greater than 1, it means the average holder can be assumed to be carrying a net unrealized profit. On the other hand, the metric being under the cutoff suggests the overall market is underwater.
Now, here is the chart for the indicator shared by the analytics firm, that shows the trend in its value for Ethereum over the past decade:
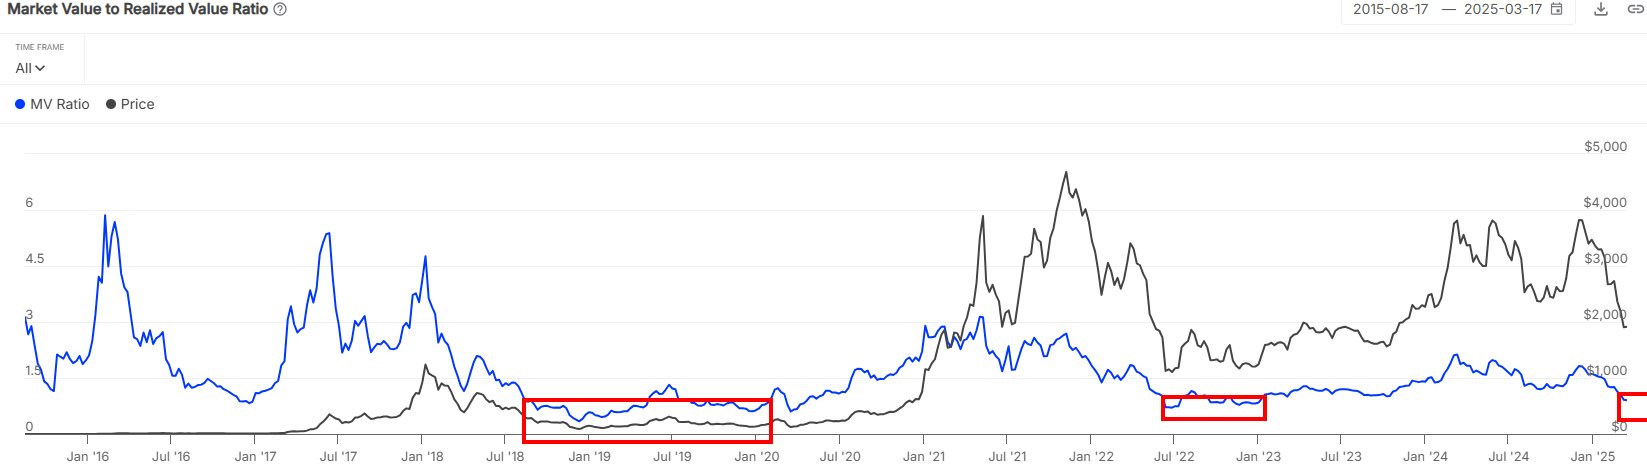
The value of the metric appears to have been sliding down in recent days | Source: IntoTheBlock on X
As is visible in the above graph, the Ethereum MVRV Ratio has gone down recently and crossed below the 1 mark, implying the ETH investors are now in net loss. The reason behind this shift in the market naturally lies in the price crash that the cryptocurrency has faced as part of a sector-wide downturn.
At present, the ETH MVRV Ratio has a value of 0.9. IntoTheBlock has noted that the indicator doesn’t attain this level often, with generally only the bear markets being able to force it this low.
An interesting pattern emerges when looking at the past price trajectory that followed periods of the indicator sitting at such lows. “Historically, MVRV ratios below 1 have coincided with favorable entry points for ETH,” says the analytics firm.
Something to note, however, is that while the MVRV Ratio falling into this zone has indeed proven to be bullish for Ethereum, the effect doesn’t tend to be immediate, with the cryptocurrency usually having to stay for extended periods in the region before a rebound occurs.
In some other news, IntoTheBlock has pointed out in another X post how a major on-chain support block exists for ETH between the $1,843 and $1,900 levels.
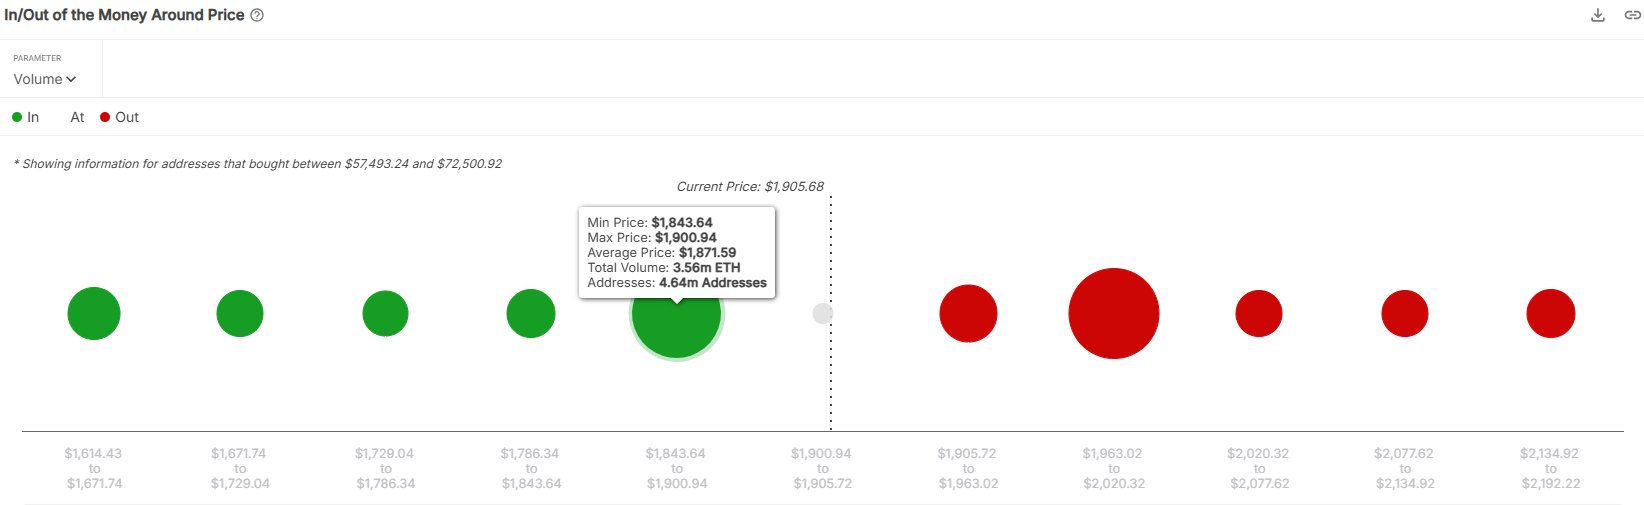
The cost basis distribution across the various price levels | Source: IntoTheBlock on X
In on-chain analysis, the strength of any support level is measured on the basis of how much of the supply was last purchased by investors at it. The aforementioned price range is particularly dense in terms of supply, as 3.56 million tokens of the asset were bought by 4.64 million addresses inside it.
“This accumulation suggests robust support, but if ETH slips below this range, the risk of capitulation grows, as demand appears notably weaker beyond this level,” says the analytics firm.
ETH Price
Ethereum is currently retesting the on-chain support zone as its price is trading around $1,877.

Looks like the price of the coin has gone stale recently | Source: ETHUSDT on TradingView
Featured image from Dall-E, IntoTheBlock.com, chart from TradingView.com

Editorial Process for bitcoinist is centered on delivering thoroughly researched, accurate, and unbiased content. We uphold strict sourcing standards, and each page undergoes diligent review by our team of top technology experts and seasoned editors. This process ensures the integrity, relevance, and value of our content for our readers.