
- The $0.55 supply zone was highlighted as a critical resistance on multiple fronts.
- For dogwifhat, the buying pressure in recent days was not strong enough to signal a trend reversal.
The memecoin market saw some relief over the past 24 hours of trading. At press time, CoinMarketCap data showed that the meme sector saw a nearly 2% increase in market cap and an 8.5% increase in daily trading volume.
This came after a Bitcoin [BTC] bounce beyond the $82.5k resistance on the 11th of April.
dogwifhat [WIF] has rallied 9% in 24 hours, but it still had a bearish outlook on the higher timeframes. The Solana [SOL] -based meme followed SOL’s 18% move higher over the past three days.
Should WIF traders expect the momentum to be sustained over the coming week?
Traders would likely be more profitable selling than buying WIF
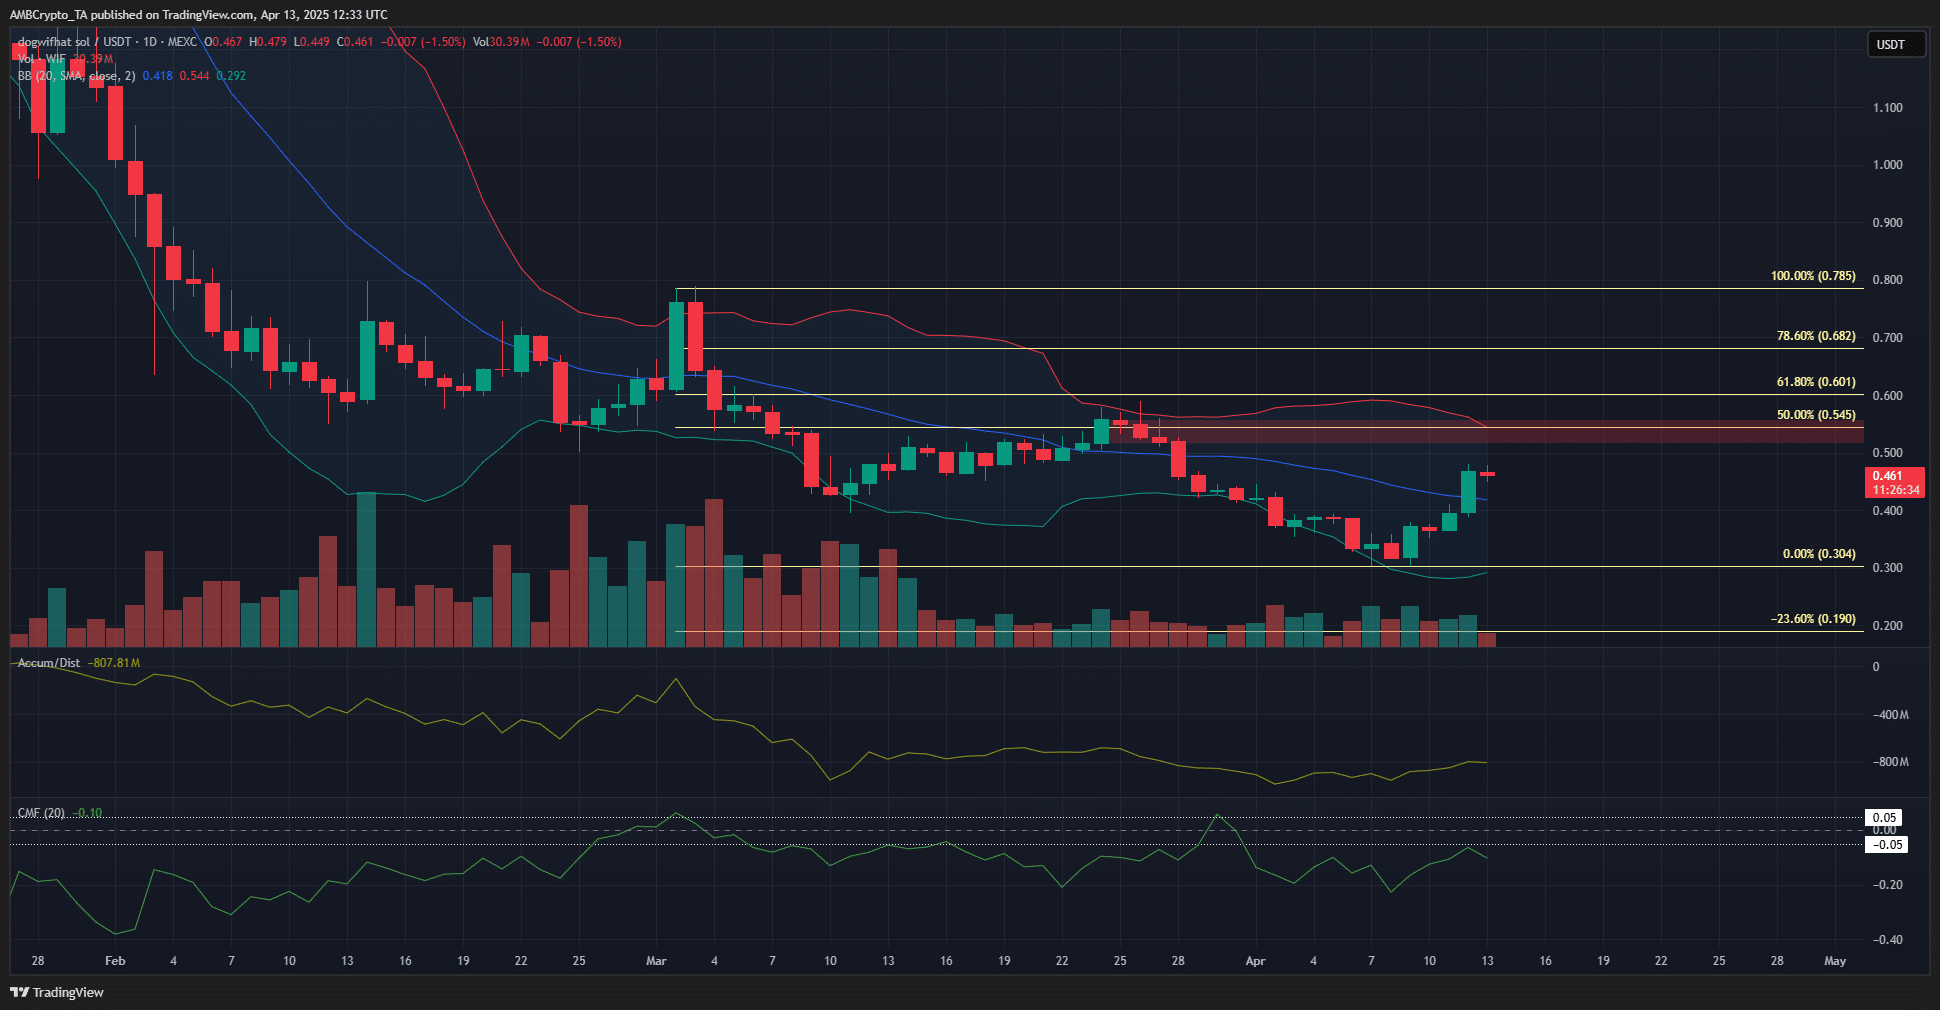
Source: WIF/USDT on TradingView
Despite the recent gains, dogwifhat labored under a bearish structure on the daily chart, like many other altcoins. The losses in recent weeks were too severe to recover, and traders and investors would be better off looking for selling opportunities.
Technical analysis helped narrow down where those opportunities may present themselves.
Highlighted in red, the bearish order block at $0.55 coincided with the 50% Fibonacci retracement level, plotted based on the past six weeks’ downtrend. It also had confluence with the upper Bollinger Band.
The A/D indicator saw a bounce in April but could not climb above the recent high set in the third week of March. This showed some buying pressure, but no dominance from them.
The CMF was more scathing. It has been below -0.05 for the majority of the past three months. Together, the volume indicators underlined the steady selling pressure and the lack of bullish strength.
Traders can use the $0.5-$0.55 region to sell WIF.
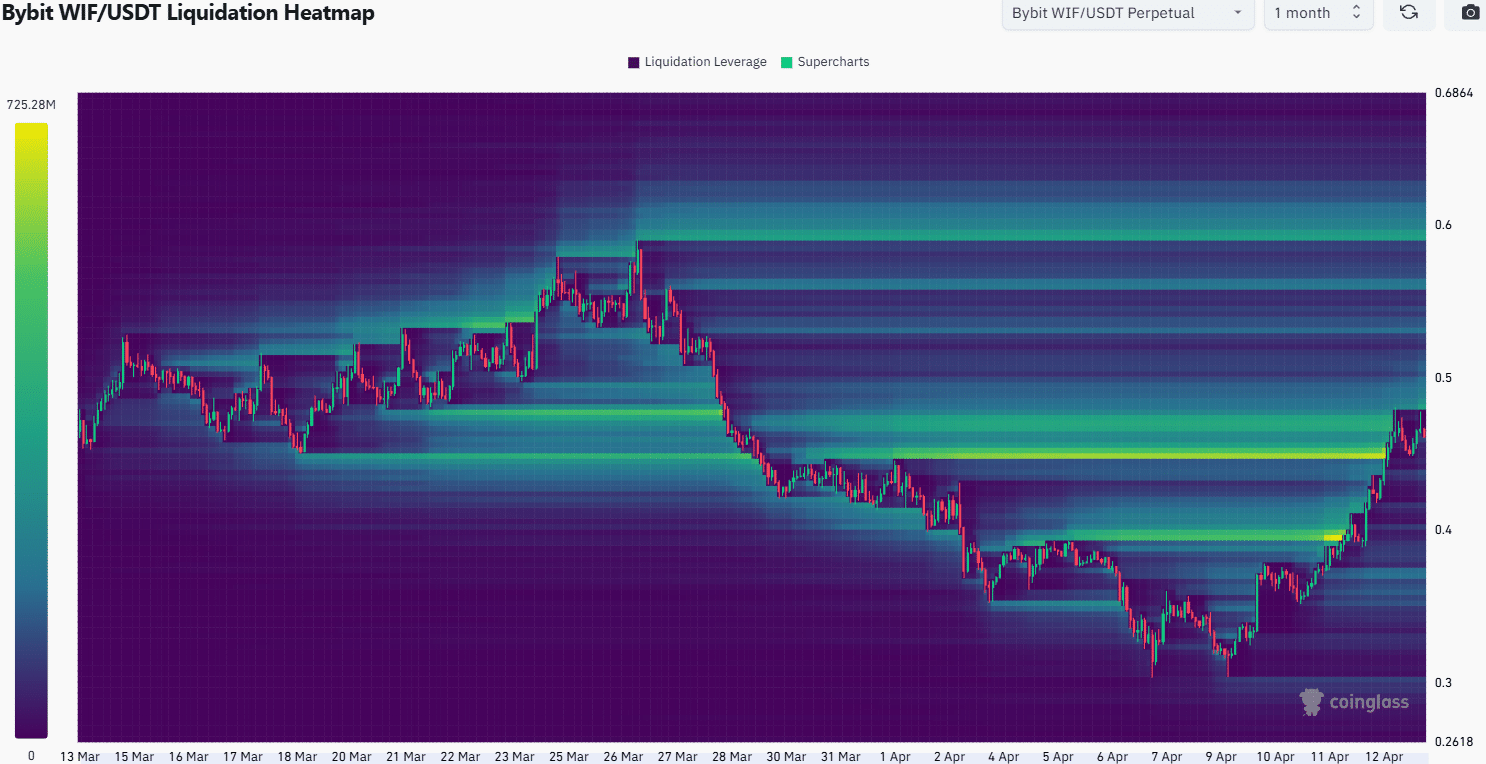
Source: Coinglass
The 1-month liquidation heatmap showed that the $0.45-$0.47 region had been filled with short liquidations. After sweeping this level, WIF bulls were able to maintain prices above $0.42, instead of seeing their gains wiped out quickly. The BTC price move higher could have influenced market sentiment.
The build-up of liquidity around $0.48-$0.5 marked it as a short-term target. Further north, the $0.6 level was the next notable liquidity pocket. Given the confluence of resistances around $0.55 and weak demand, a breakout appeared unlikely.
If WIF can consolidate around $0.46 over the next 24-48 hours, the liquidity around $0.5 would likely grow thicker. This scenario of WIF consolidation over the next day, followed by a price bounce and a bearish reversal thereafter, appeared the most likely short-term outcome.
Traders looking to short the memecoin need to watch the $0.5-$0.55 area, as well as the trend of BTC, to determine if selling would be a feasible option or not.
Disclaimer: The information presented does not constitute financial, investment, trading, or other types of advice and is solely the writer’s opinion