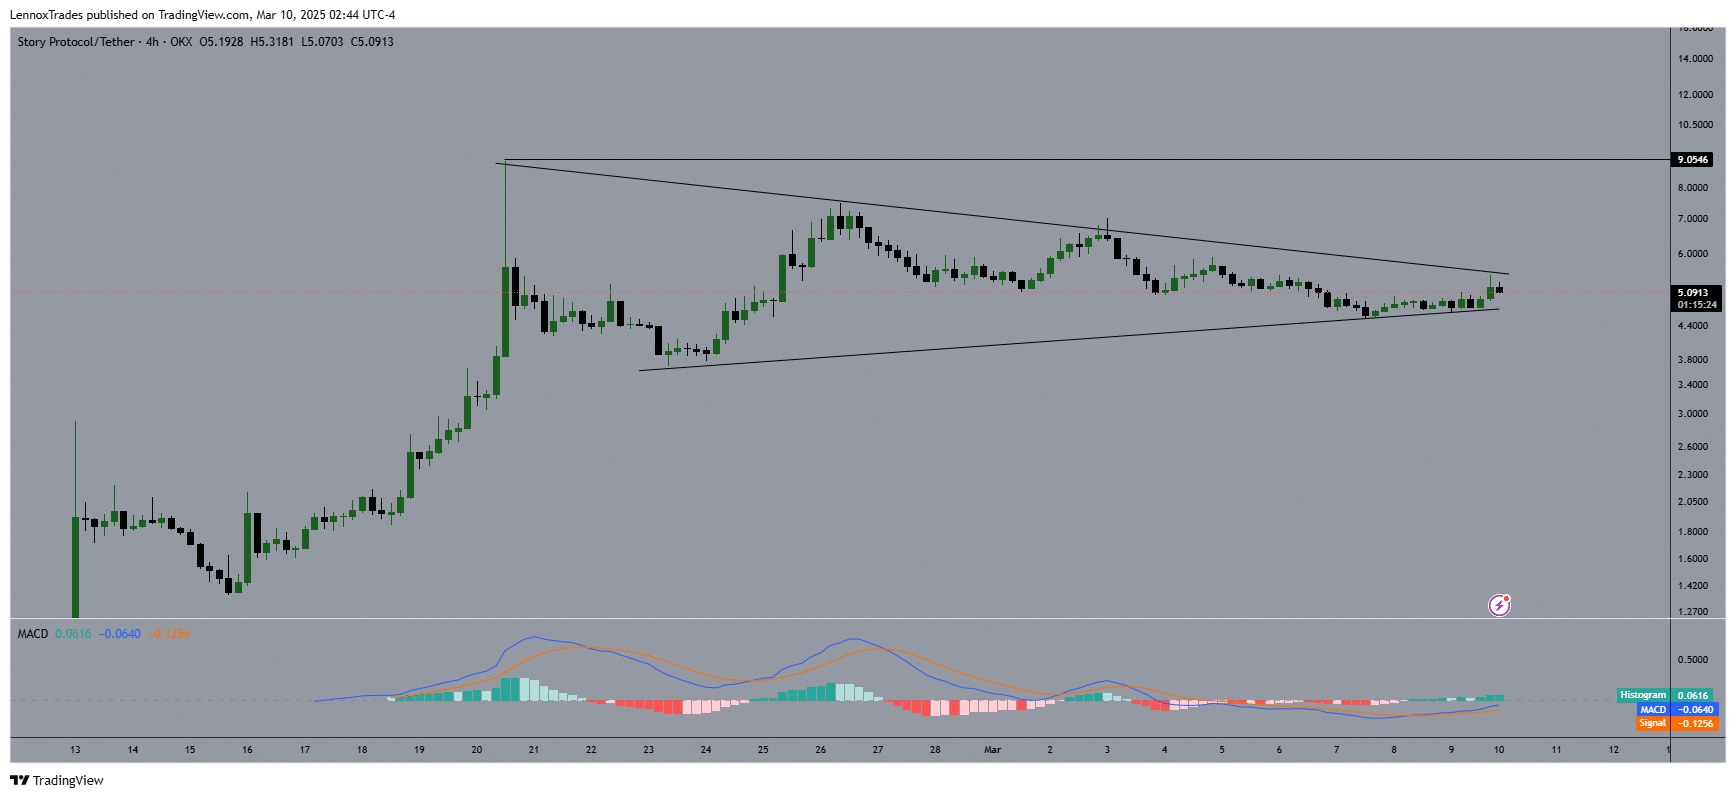
- IP was consolidating within a symmetrical triangle that was on the verge of a breakout at the apex of the pattern.
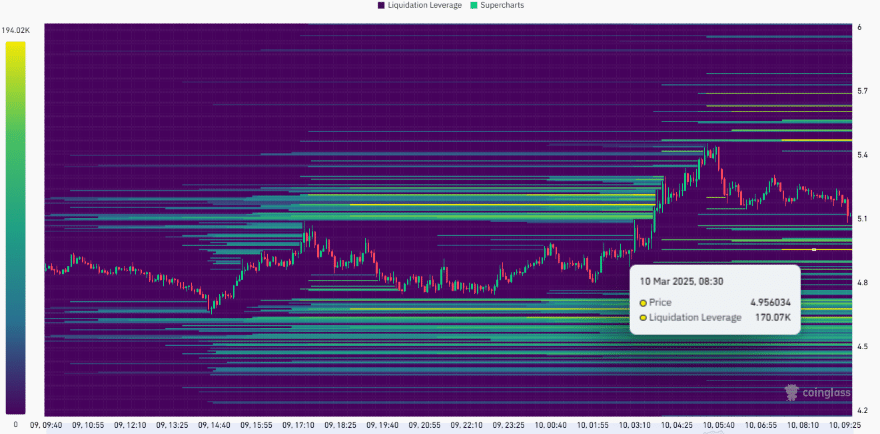
- The liquidation heatmap showed that crossing $5.50 could drive IP towards $5.70 and suggests bullish strength.
The price action of Story [IP] suggested a point of breakdown in a symmetrical triangle pattern. IP fluctuated between $3.50 and a high of $9.05 which was the range for the triangle pattern.
As of press time, IP’s price hovered around $5.00, suggesting consolidation at the triangle’s apex and hinting at a potential near-term breakout.
The MACD indicator, with a histogram value of -0.0024, displayed bearish momentum, as the MACD line was marginally below the signal line.
An upward breakout from the pattern could push IP’s price above $9.00, provided the MACD histogram turns positive, and the move is supported by higher trading volume.
Conversely, a breakdown below the pattern, accompanied by further weakening of the MACD, could drive the price down to levels below $3.00.
If the price of IP continues to trade within the pattern, a rebound toward higher levels could be on the cards with a neutral MACD. Equally, a bearish breakout could send IP down to $3.00.
With current consolidation and a bearish MACD, a breach below $3.00 is more likely unless market sentiment strengthens, pushing IP past resistance to $10.00.
IP’s liquidation and spot flow ratio
Further analysis of the Binance IP/USDT pair using the 24-hour liquidation heatmap on Coinglass highlighted significant liquidity regions that appear to influence IP’s price movement.
At the time of writing, IP’s price ranged between $4.20 and $5.80, with recent stabilization around $5.00.
These liquidity-rich regions act as price magnets. Key levels include $5.50 as a potential resistance, $5.00 as the current support, $4.50 as a minor support, and $5.70 as an upper resistance.
This suggests that IP might trend toward $5.50, as prices often gravitate toward high-liquidity areas for stop-loss or forced liquidations. A breakout above $5.50 could propel the price to $5.70, indicating bullish momentum.
Failing to hold above $5.00, however, could spark a decline to $4.5 as increasing selling flows in. The levels at $5.7 and $6.0 suggest higher-term objectives should a bullish trend prevail.
The Coinglass IP Spot Inflow/Outflow chart also depicted a positive netflow in the last 24 hours, at press time.
Netflow varied between -$4M and $1M, with significant outflows of -$4M on the 25th of February and inflows of $1M on the 4th of March. However, IP’s recent netflow stood at $175K.
Netflow merely came close to zero, indicating flat action, while the price dropped from $7.00 to $5.00. This would point toward selling pressure because previous outflows may have moderated, yet weaker inflow can limit upside force.
IP follow-through behavior might test $7.00 in case there’s increasing acceleration of inflows or go down to $4.09 in case outflows prevail throughout, signifying underlying marketplace uncertainty.

![Mapping Story’s [IP] next move: Traders, watch out for THIS level](https://yeek.io/wp-content/uploads/2025/03/Mapping-Storys-IP-next-move-Traders-watch-out-for-THIS.jpg)


