Reason to trust
Strict editorial policy that focuses on accuracy, relevance, and impartiality
Created by industry experts and meticulously reviewed
The highest standards in reporting and publishing
Strict editorial policy that focuses on accuracy, relevance, and impartiality
Morbi pretium leo et nisl aliquam mollis. Quisque arcu lorem, ultricies quis pellentesque nec, ullamcorper eu odio.
Ethereum has struggled to gain momentum, remaining stuck below critical resistance for over a year. Despite multiple attempts, the second-largest cryptocurrency by market capitalization has been unable to break through key technical levels since the beginning of this year.
Related Reading
Ethereum’s price action over the past two weeks has shown more weakness. An interesting analysis from analyst Tony “The Bull” Severino shows that the cryptocurrency recently failed to break above a resistance indicator and is now at risk of more catastrophic price drops.
Ethereum Fails To Breach Long-Term Resistance
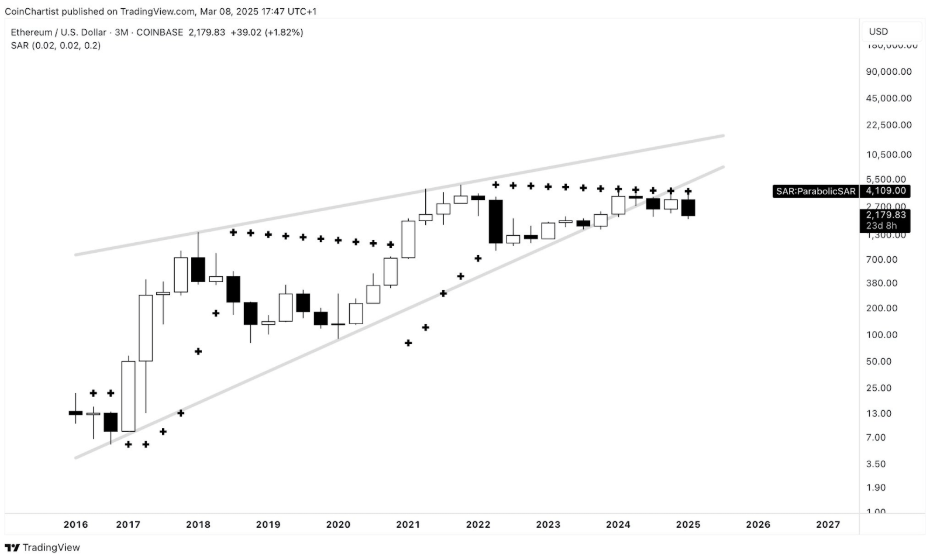
Tony “The Bull” Severino, in a technical analysis shared on social media platform X, highlighted Ethereum’s persistent failure to overcome major resistance levels. He pointed out that Ethereum has been unable to tag the quarterly (three-month) Parabolic SAR despite more than a year of attempts. This indicator, often used to determine the direction of an asset’s trend, shows that Ethereum is locked in a prolonged struggle against resistance on a larger downtrend.
“This feels like it sends a message — resistance won’t be broken,” the analyst said.

Image From X: Tony “The Bull” Severino
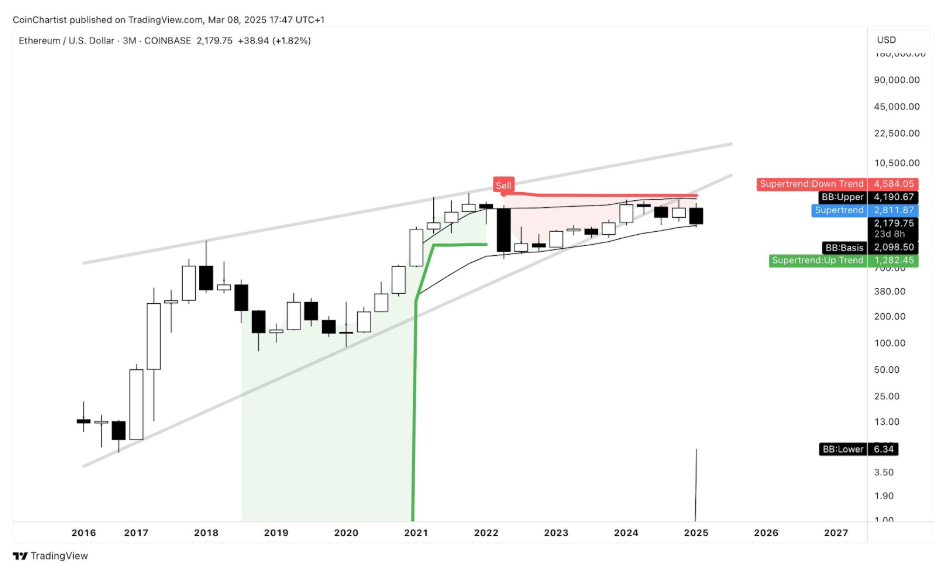
Adding to the failure to break resistance, Tony Severino also noted in another analysis that Ethereum has repeatedly faced rejection from the quarterly (3M) SuperTrend dynamic resistance, further solidifying the case that buyers have been unable to regain control.

Image From X: Tony “The Bull” Severino
A Monthly Close Below $2,100 Could Be Catastrophic
Ethereum’s inability to sustain key price levels has been a dominant theme in the past six months. Interestingly, this inability was shown further in the past two weeks. After failing to hold above $2,800, the cryptocurrency has seen a steady drop, losing multiple support zones along the way.
Currently, Ethereum is trading below $2,200, edging dangerously close to breaking below the crucial $2,100 threshold. A drop beneath this level is particularly concerning, not just because it signifies the loss of yet another psychological support but because technical indicators suggest that a monthly close below $2,100 could have severe consequences.
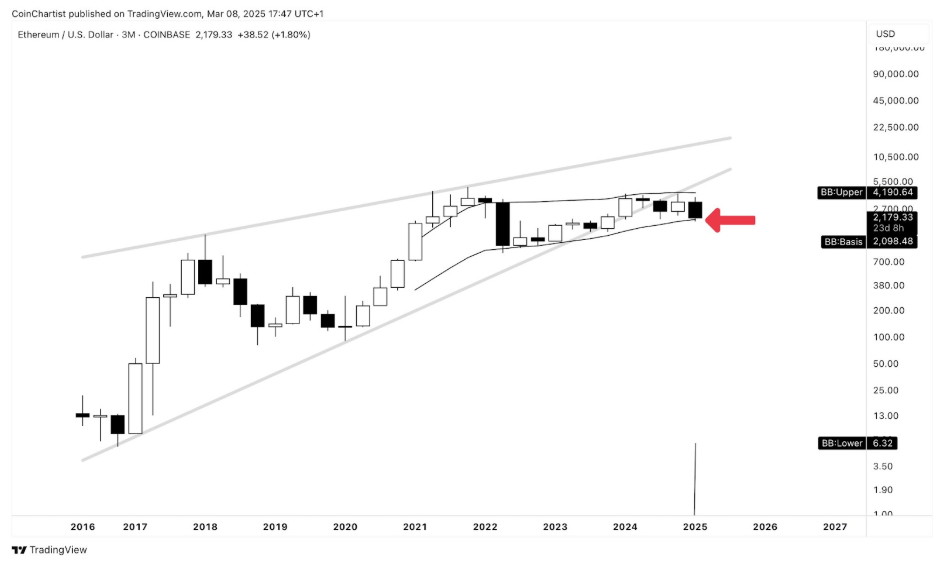
One of the most significant warning signs comes from the quarterly Bollinger Bands indicator, which has tracked Ethereum’s price action since February 2022. According to this indicator, Ethereum has remained within a defined range, with the upper Bollinger Band currently positioned at $4,190 and the lower band at $2,098. The worrying part is that a monthly close below $2,100 would effectively translate to breaking beneath the lower Bollinger Band and removing a long-standing support level.

Image From X: Tony “The Bull” Severino
Related Reading
At the time of writing, Ethereum is trading at $2,178, having gained 2.2% in the past 24 hours after starting the day at $2,120. Ethereum’s sentiment is now at its lowest level this year. The next few weeks will be crucial to see if Ethereum can reclaim lost ground and prevent a monthly close below $2,100.
Featured image from Tech Magazine, chart from TradingView

