
- Recent trends show steady, measured growth for NEAR’s Total Value Locked (TVL).
- NEAR could see a brief rally before potentially dropping to the $2.45 level.
Over the past 24 hours, NEAR Protocol [NEAR] has emerged as one of the market’s top gainers, surging by 10.42%. This marked its first double-digit gain following a month-long decline of 25.79%.
Despite the recent upward momentum, a broader perspective reveals potential obstacles that could hinder further growth. If these barriers hold, NEAR might face a drop into lower price regions.
Consistency amid declining activity
According to DeFiLlama, the Total Value Locked (TVL) on NEAR Protocol has maintained a steady range, oscillating between $259.85 million and $236.58 million.
At press time, the TVL stood at $253.52 million. This range often indicates active participation, though it leaves room for either a significant rally or a sharp decline.
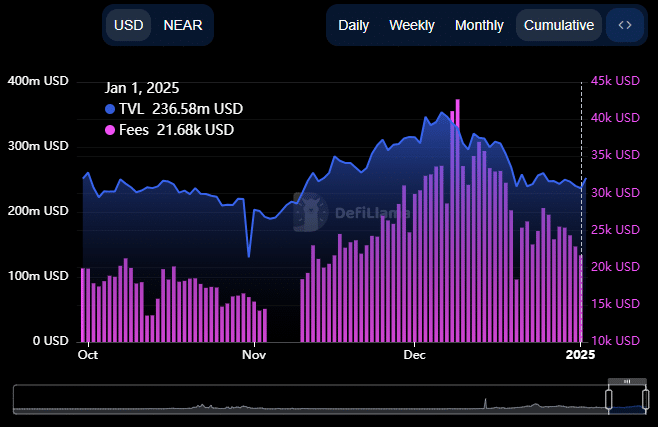
Source: DeFiLlama
TVL represents the total value of assets locked in a blockchain’s smart contracts, showing the level of user engagement across activities such as staking, lending, and liquidity provision.
But the TVL doesn’t give much information as a standalone. To gain further insight into NEAR’s on-chain activity, AMBCrypto analyzed its fee data.
Higher fees often indicate increased network activity, while lower fees suggest a slowdown.
As of this writing, NEAR recorded its lowest fee generation in the past eleven days, with $21,680 collected.
This decline points to reduced user participation, which could negatively affect NEAR’s price performance and its ecosystem’s growth trajectory.
Mixed signals: MACD and RSI diverge
Technical indicators for NEAR were conflicting, with the Moving Average Convergence Divergence (MACD) pointing to a bearish trend, while the Relative Strength Index (RSI) suggested increasing momentum.
On the weekly chart, the MACD appeared close to forming a bearish Death Cross—a pattern that occurs when the MACD line (blue) crosses below the signal line (orange).
This is typically accompanied by an increasing number of red histogram bars, which further confirm bearish sentiment. If this pattern solidifies, NEAR’s price may start trending downward.
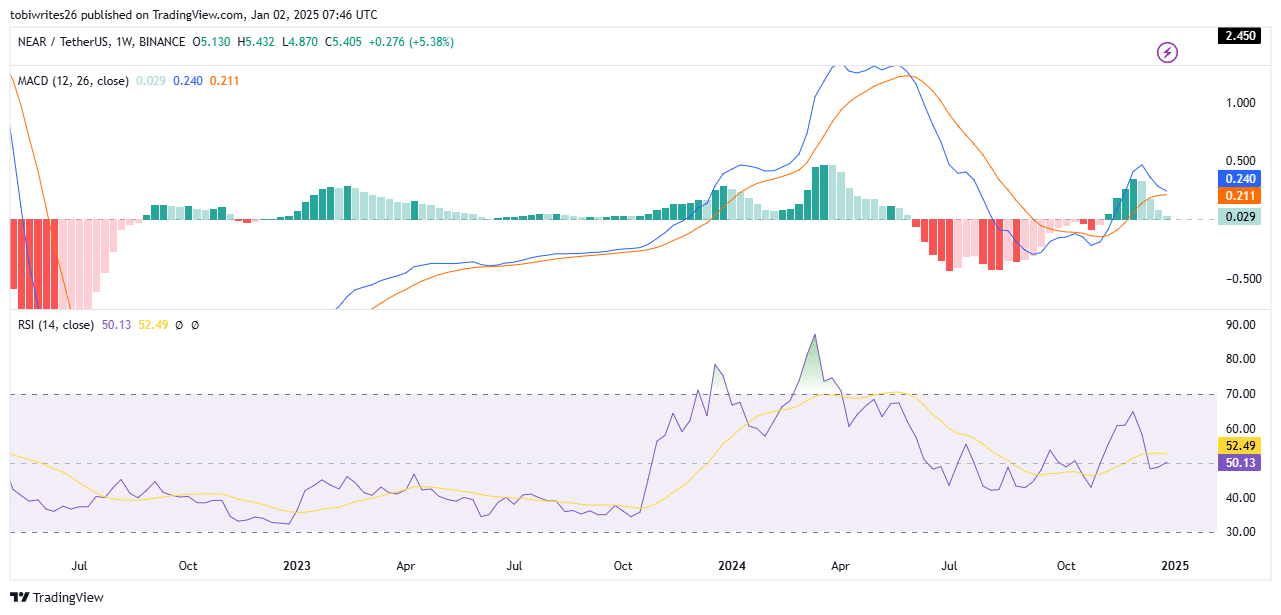
Source: TradingView
Despite this looming bearish signal, the RSI offered a more optimistic view. It has recently returned to the positive region, with a press time reading of 50.13, indicating mild bullish momentum.
However, the RSI’s position near the neutral line (50) still suggests uncertainty. A drop below this level could trigger a bearish reversal, reinforcing the downside risks.
Additional analysis by AMBCrypto indicates that while the RSI may climb slightly in the short term, it is likely to reverse and fall below the neutral zone, aligning with the MACD’s bearish outlook.
Key levels come into focus
On the weekly chart, NEAR may first push higher into a supply zone before reversing back to a support zone. From there, it could bounce briefly before falling further to the $2.45 target, as suggested by the current price setup.
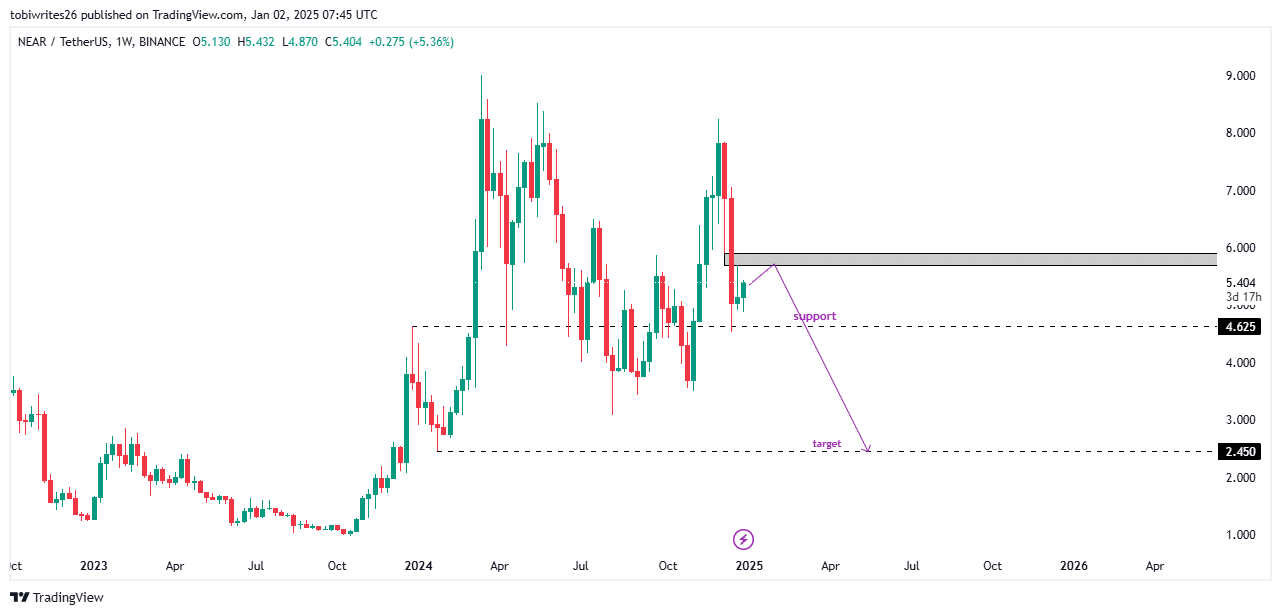
Source: TradingView
Read NEAR Protocol’s [NEAR] Price Prediction 2025–2026
If the supply zone fails to hold, NEAR could climb higher, regaining bullish momentum and possibly setting a new monthly high.
With the impending death cross on the MACD, which could trigger a major drop in price, alongside other metrics, NEAR still tilt to the bearish end.