Close Menu
    What's Hot

    OBV rises, price falls: Why TRUMP’s ‘buy’ signals may be misleading

    Crypto Lending Protocol ZeroLend Shuts Down Citing Sustainability Concerns and Hacks

    Decoding PIPPIN’s 14% slide – Can the AI coin hold THIS amid profit-taking?

    Facebook X (Twitter) Instagram
    yeek.io
    • Crypto Chart
    • Crypto Price Chart
    X (Twitter) Instagram TikTok
    Trending Topics:
    • Altcoin
    • Bitcoin
    • Blockchain
    • Crypto News
    • DeFi
    • Ethereum
    • Meme Coins
    • NFTs
    • Web 3
    yeek.io
    • Altcoin
    • Bitcoin
    • Blockchain
    • Crypto News
    • DeFi
    • Ethereum
    • Meme Coins
    • NFTs
    • Web 3
    Meme Coins

    OBV rises, price falls: Why TRUMP’s ‘buy’ signals may be misleading

    Yeek.ioBy Yeek.ioFebruary 18, 2026No Comments3 Mins Read
    Share Facebook Twitter Pinterest Copy Link Telegram LinkedIn Tumblr Email
    Share
    Facebook Twitter LinkedIn Pinterest Email

    Journalist

    Posted: February 18, 2026

    The Official Trump [TRUMP] memecoin was down 95.4% from its all-time high. A recent AMBCrypto report highlighted the imbalance between $3.57 and $4.09 on the daily chart.

    On Saturday, the 14th of February, TRUMP bounced into this supply zone, reaching $3.64. Since then, it has shed 7.14% and was trading at $3.38 at the time of writing.

    It appeared likely that the price would continue its descent below the $3 round-number support.

    The 6.33 TRUMP token unlock can add to the selling pressure on the memecoin.

    Trump-backed World Liberty Financial was facing an investigation into a $500 million foreign investment linked to the UAE, which did little to improve TRUMP’s optics.

    Add to it the strong short-term selling pressure on Bitcoin [BTC], and it was clear that the Official Trump token prices were highly likely to continue their longer-term downtrend.

    Gauging TRUMP’s reaction at the $3.6 supply zone

    TRUMP 1-hour ChartTRUMP 1-hour Chart

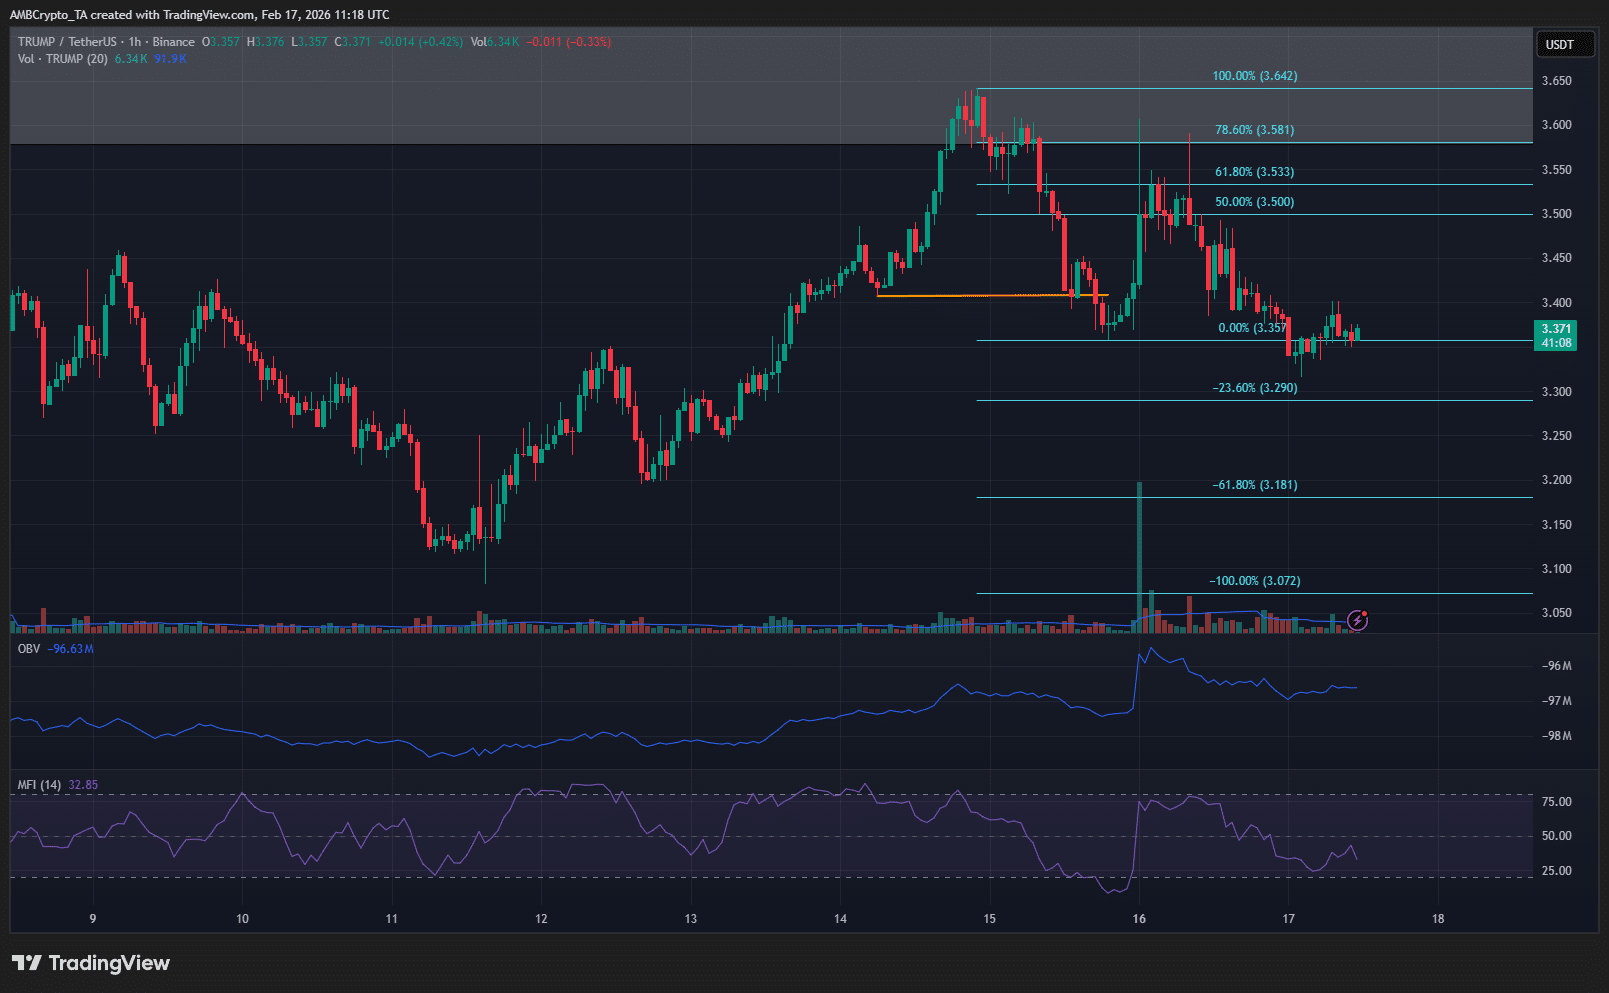
    Source: TRUMP/USDT on TradingView

    The daily imbalance and supply zone highlighted earlier saw an immediate rejection of TRUMP prices over the past three days.

    Highlighted in white on the hourly chart above, the TRUMP structure has shifted bearishly after this rejection. Using a set of Fibonacci retracement and extension levels illustrated the path ahead in the coming days.

    The second rejection from $3.58, the 78.6% retracement level (cyan), meant that the southward extension levels down to $3.07 were the immediate targets.

    The OBV on the 1-hour timeframe was not bearish. In fact, it has been trending higher over the past week, though it saw a dip over the past two days.

    Meanwhile, the RSI’s descent below neutral 50 hinted at a momentum shift.

    Traders shouldn’t be fooled by the OBV’s movement over the past week. The higher timeframe bias remained firmly bearish.

    Moreover, the short-term price structure made it highly likely that the memecoin will fall to $3.29 and all the way to $3.07 in the coming days.


    Final Summary

    • TRUMP token prices bounced to $3.64 last week. It surpassed the  $3.58 local highs and the OBV that was trending higher on the 1-hour timeframe.
    • Traders and investors should not be fooled by this seeming influx of buying pressure and remember that the long and short-term bias remained bearish.

    Disclaimer: The information presented does not constitute financial, investment, trading, or other types of advice and is solely the writer’s opinion.

    Next: DEEP breaks descending channel after 12% surge – Is a bigger rally ahead?

    Follow on Google News Follow on Flipboard
    Share. Facebook Twitter Pinterest LinkedIn Tumblr Email Copy Link
    Previous ArticleCrypto Lending Protocol ZeroLend Shuts Down Citing Sustainability Concerns and Hacks
    Avatar
    Yeek.io
    • Website

    Yeek.io is your trusted source for the latest cryptocurrency news, market updates, and blockchain insights. Stay informed with real-time updates, expert analysis, and comprehensive guides to navigate the dynamic world of crypto.

    Related Posts

    Decoding PIPPIN’s 14% slide – Can the AI coin hold THIS amid profit-taking?

    February 17, 2026

    SIREN breaks key level, 42% upside rally in focus

    February 17, 2026

    Memecore [M] fades from $1.60 peak – But THESE 2 metrics suggest…

    February 17, 2026
    Leave A Reply Cancel Reply

    Advertisement
    Demo
    Latest Posts

    OBV rises, price falls: Why TRUMP’s ‘buy’ signals may be misleading

    Crypto Lending Protocol ZeroLend Shuts Down Citing Sustainability Concerns and Hacks

    Decoding PIPPIN’s 14% slide – Can the AI coin hold THIS amid profit-taking?

    Crypto Venture Firm Dragonfly Secures $650M for Its Fourth Fund

    Popular Posts
    Advertisement
    Demo
    X (Twitter) TikTok Instagram

    Categories

    • Altcoin
    • Bitcoin
    • Blockchain
    • Crypto News

    Categories

    • Defi
    • Ethereum
    • Meme Coins
    • Nfts

    Quick Links

    • Home
    • About
    • Contact
    • Privacy Policy

    Important Links

    • Crypto Chart
    • Crypto Price Chart
    © 2026 Yeek. All Copyright Reserved

    Type above and press Enter to search. Press Esc to cancel.