Close Menu
    What's Hot

    ‘Market knows something’: Meteora’s odds climb to 28% on Polymarket

    21Shares brings new SUI Spot ETF to Nasdaq: ‘The moment is finally here!’

    Dogecoin – Why history suggests holders can expect 2 more years of pain

    Facebook X (Twitter) Instagram
    yeek.io
    • Crypto Chart
    • Crypto Price Chart
    X (Twitter) Instagram TikTok
    Trending Topics:
    • Altcoin
    • Bitcoin
    • Blockchain
    • Crypto News
    • DeFi
    • Ethereum
    • Meme Coins
    • NFTs
    • Web 3
    yeek.io
    • Altcoin
    • Bitcoin
    • Blockchain
    • Crypto News
    • DeFi
    • Ethereum
    • Meme Coins
    • NFTs
    • Web 3
    Altcoin

    Raydium gains 62% in 8 days – Can RAY successfully reach $8?

    Yeek.ioBy Yeek.ioJanuary 21, 2025No Comments2 Mins Read
    Share Facebook Twitter Pinterest Copy Link Telegram LinkedIn Tumblr Email
    Share
    Facebook Twitter LinkedIn Pinterest Email
    • Raydium saw steady demand throughout its range-bound price action.
    • The short-term bullish target was the $8-$8.2 liquidity pocket.

    Raydium [RAY] saw 62% gains over the past eight days. The rise of Official Trump [TRUMP] on the Solana [SOL] chain has also likely boosted demand for RAY, but its rally began before the launch of the TRUMP meme coin.

    Since November, it had traded within a range that extended from $4.02 to $6.3. This range was broken on the 18th of January, and its highs were retested as a support zone.

    Raydium breaks range formation, set to sail higher

    Raydium 1-day Chart

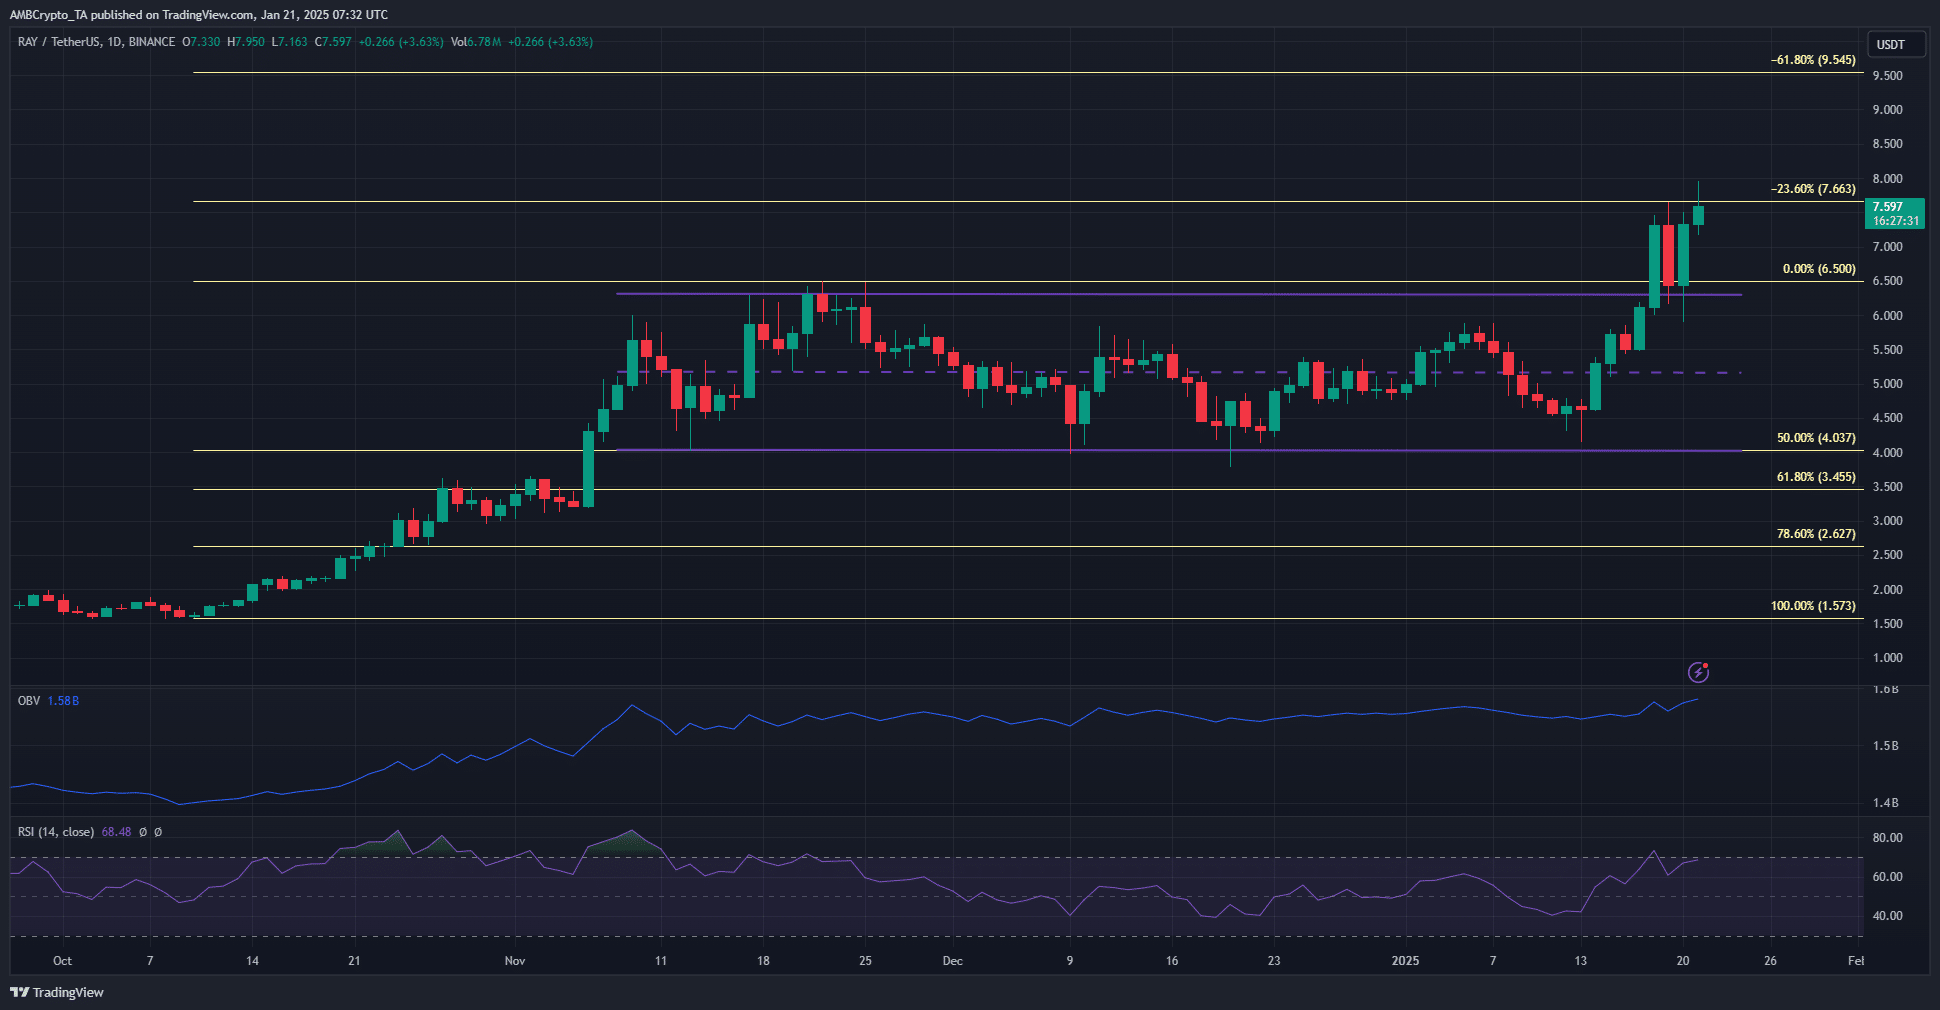
    Source: RAY/USDT on TradingView

    The strong demand for Raydium was reflected on the price charts. Over the past two months, despite the range formation, the OBV continued to trend higher. This was a sign of steady buying pressure.

    Additionally, the breakout beyond the range highs occurred on high trading volume, indicating conviction. The Fibonacci retracement and extension levels were plotted based on the October and November rally from $1.57 to $6.5.

    It showed that the next targets for RAY bulls were $7.66 and $9.54. The daily RSI was above 60, showing strong bullish momentum.

    Combined with the steady buying pressure, Raydium was likely to move toward $9.54 in the coming days and weeks.
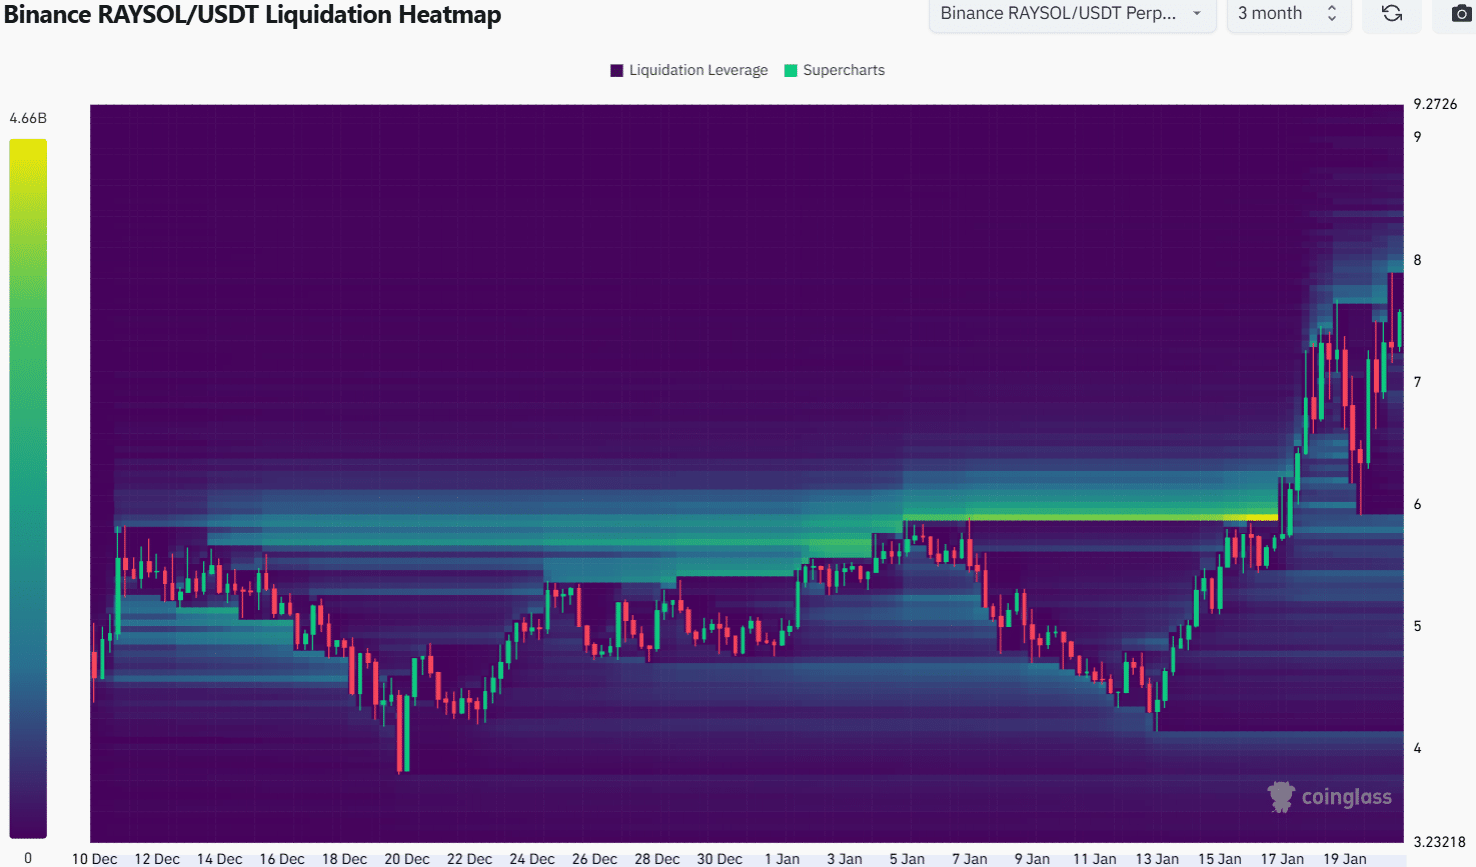
    Raydium Liquidation HeatmapRaydium Liquidation Heatmap

    Source: Coinglass

    The 3-month liquidation heatmap highlighted a pocket of liquidity at $8 and another at $7.12. Below this, the $7 was another magnetic zone.

    Since the recent move has already retested the range highs at $6.3, another immediate dip to $7.12 was unlikely.

    Instead, a move toward $8 and then a reversal and a sweep of the $7-$7.1 region appeared more likely.
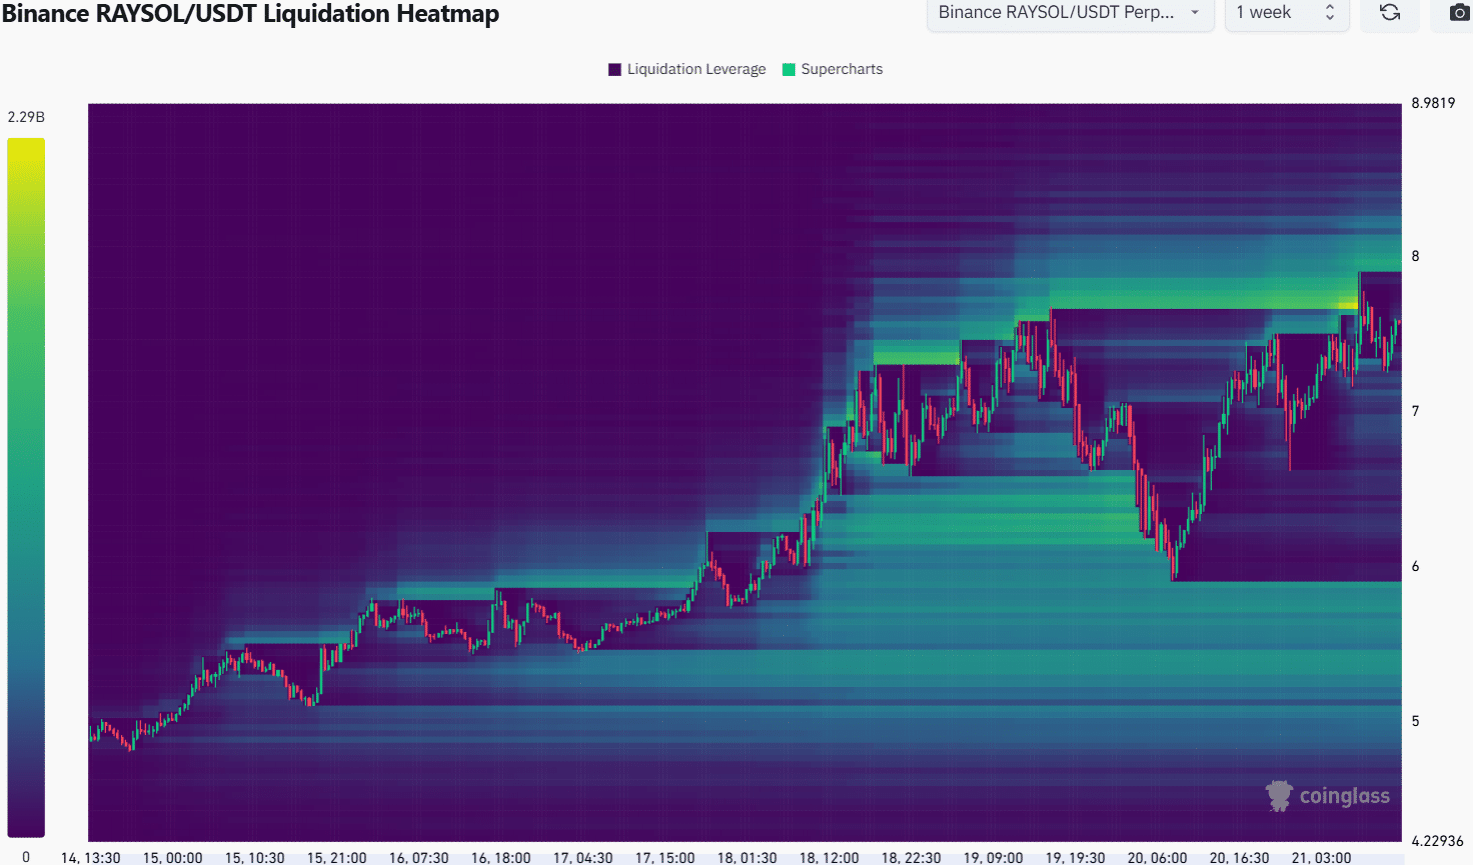
    Raydium Liquidation HeatmapRaydium Liquidation Heatmap

    Source: Coinglass

    The 1-week liquidation heatmap also highlighted the $8 liquidity pocket. It made it clear that the $7.93-$8.21 had a noticeable density of liquidation levels that could draw RAY prices toward it.


    Read Raydium’s [RAY] Price Prediction 2025-26


    To the south, the $7.12 and $6.96 levels were less bright, since they had fewer liquidation levels.

    A move to $8 and a few days of consolidation could build up long liquidation levels to the south, which Raydium prices can later take out before continuing the upward move.

    Disclaimer: The information presented does not constitute financial, investment, trading, or other types of advice and is solely the writer’s opinion

    Next: Ethereum eyes $3500 – Can Q1 trends fuel a rally?

    Follow on Google News Follow on Flipboard
    Share. Facebook Twitter Pinterest LinkedIn Tumblr Email Copy Link
    Previous ArticleDogecoin Price Breaks Out Of Falling Wedge Formation, Is A 50% Jump Possible From Here?
    Next Article SEC Establishes Task Force to Develop a Clear Regulatory Framework for Crypto Assets
    Avatar
    Yeek.io
    • Website

    Yeek.io is your trusted source for the latest cryptocurrency news, market updates, and blockchain insights. Stay informed with real-time updates, expert analysis, and comprehensive guides to navigate the dynamic world of crypto.

    Related Posts

    Why is crypto up today—FOMC news, ETF flows and…

    March 20, 2025

    Binance Coin (BNB) Price Prediction for March 20

    March 20, 2025

    Trump becomes first US sitting president to speak at a crypto conference

    March 20, 2025
    Leave A Reply Cancel Reply

    Advertisement
    Demo
    Latest Posts

    ‘Market knows something’: Meteora’s odds climb to 28% on Polymarket

    21Shares brings new SUI Spot ETF to Nasdaq: ‘The moment is finally here!’

    Dogecoin – Why history suggests holders can expect 2 more years of pain

    PIPPIN price prediction: How AI-memecoin outpaced Bitcoin to post 22% rally

    Popular Posts
    Advertisement
    Demo
    X (Twitter) TikTok Instagram

    Categories

    • Altcoin
    • Bitcoin
    • Blockchain
    • Crypto News

    Categories

    • Defi
    • Ethereum
    • Meme Coins
    • Nfts

    Quick Links

    • Home
    • About
    • Contact
    • Privacy Policy

    Important Links

    • Crypto Chart
    • Crypto Price Chart
    © 2026 Yeek. All Copyright Reserved

    Type above and press Enter to search. Press Esc to cancel.