Close Menu
    What's Hot

    Ethereum Prepares For A Parabolic Move – ETH/BTC Chart Signals Strong Bullish Setup

    Ethereum Enters Strategic Pause: Will Accumulation Below Resistance Spark A Surge?

    Solana indicators point north, bulls test $165 target

    Facebook X (Twitter) Instagram
    yeek.io
    • Crypto Chart
    • Crypto Price Chart
    X (Twitter) Instagram TikTok
    Trending Topics:
    • Altcoin
    • Bitcoin
    • Blockchain
    • Crypto News
    • DeFi
    • Ethereum
    • Meme Coins
    • NFTs
    • Web 3
    yeek.io
    • Altcoin
    • Bitcoin
    • Blockchain
    • Crypto News
    • DeFi
    • Ethereum
    • Meme Coins
    • NFTs
    • Web 3
    Meme Coins

    Shiba Inu: Assessing if SHIB bulls can defend $0.00001288

    Yeek.ioBy Yeek.ioMarch 17, 2025No Comments2 Mins Read
    Share Facebook Twitter Pinterest Copy Link Telegram LinkedIn Tumblr Email
    Share
    Facebook Twitter LinkedIn Pinterest Email


    • The Shiba Inu weekly price action laid out a strongly bearish bias.
    • The lower timeframe chart highlighted two key Fibonacci retracement levels to watch.

    Shiba Inu [SHIB] had fallen below a key long-term level last week but was trying to find its way back above. However, the price action in recent months meant the higher timeframe bias remained bearish.

    The Bitcoin [BTC] range formation in December began the SHIB movement downward. Other events saw the bullish conviction in memecoins eroded, a trend that has not yet halted.

    Shiba Inu bulls likely to have a hard time

    Shiba Inu 1-week Chart

    Source: SHIB/USDT on TradingView

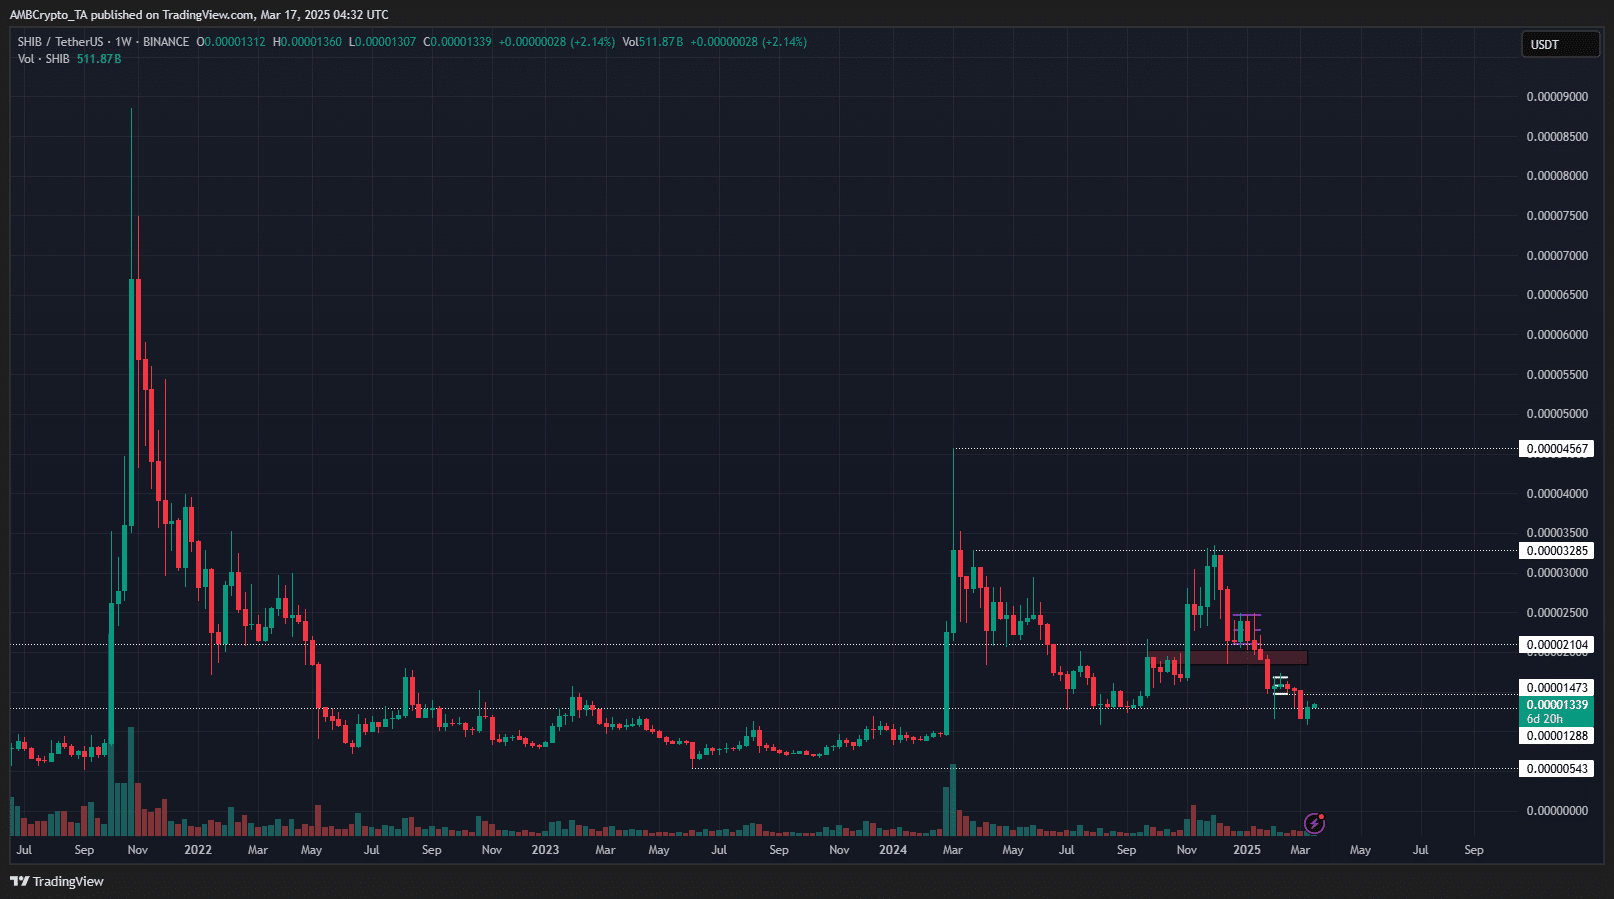
    On the weekly chart, Shiba Inu has a bearish structure. It broke below the $0.0000164 level, the lower high from November, and at press time was floating just above the $0.00001288 support. It closed the first weekly session in March below this level, reinforcing the bearish outlook.

    The rallies in early 2024 and November 2024 were unable to challenge the highs from late 2022. This was disappointing, as Bitcoin had a lot more capital inflow over the past year than in 2022. Hopes of capital rotation into the memecoin might have been misplaced.

    A bounce from the outlined weekly support is expected. However, it wouldn’t be immediate. Like the summer of 2024, there could be a few weeks of consolidation before the next move.

    Shiba Inu 6-hour ChartShiba Inu 6-hour Chart

    Source: SHIB/USDT on TradingView

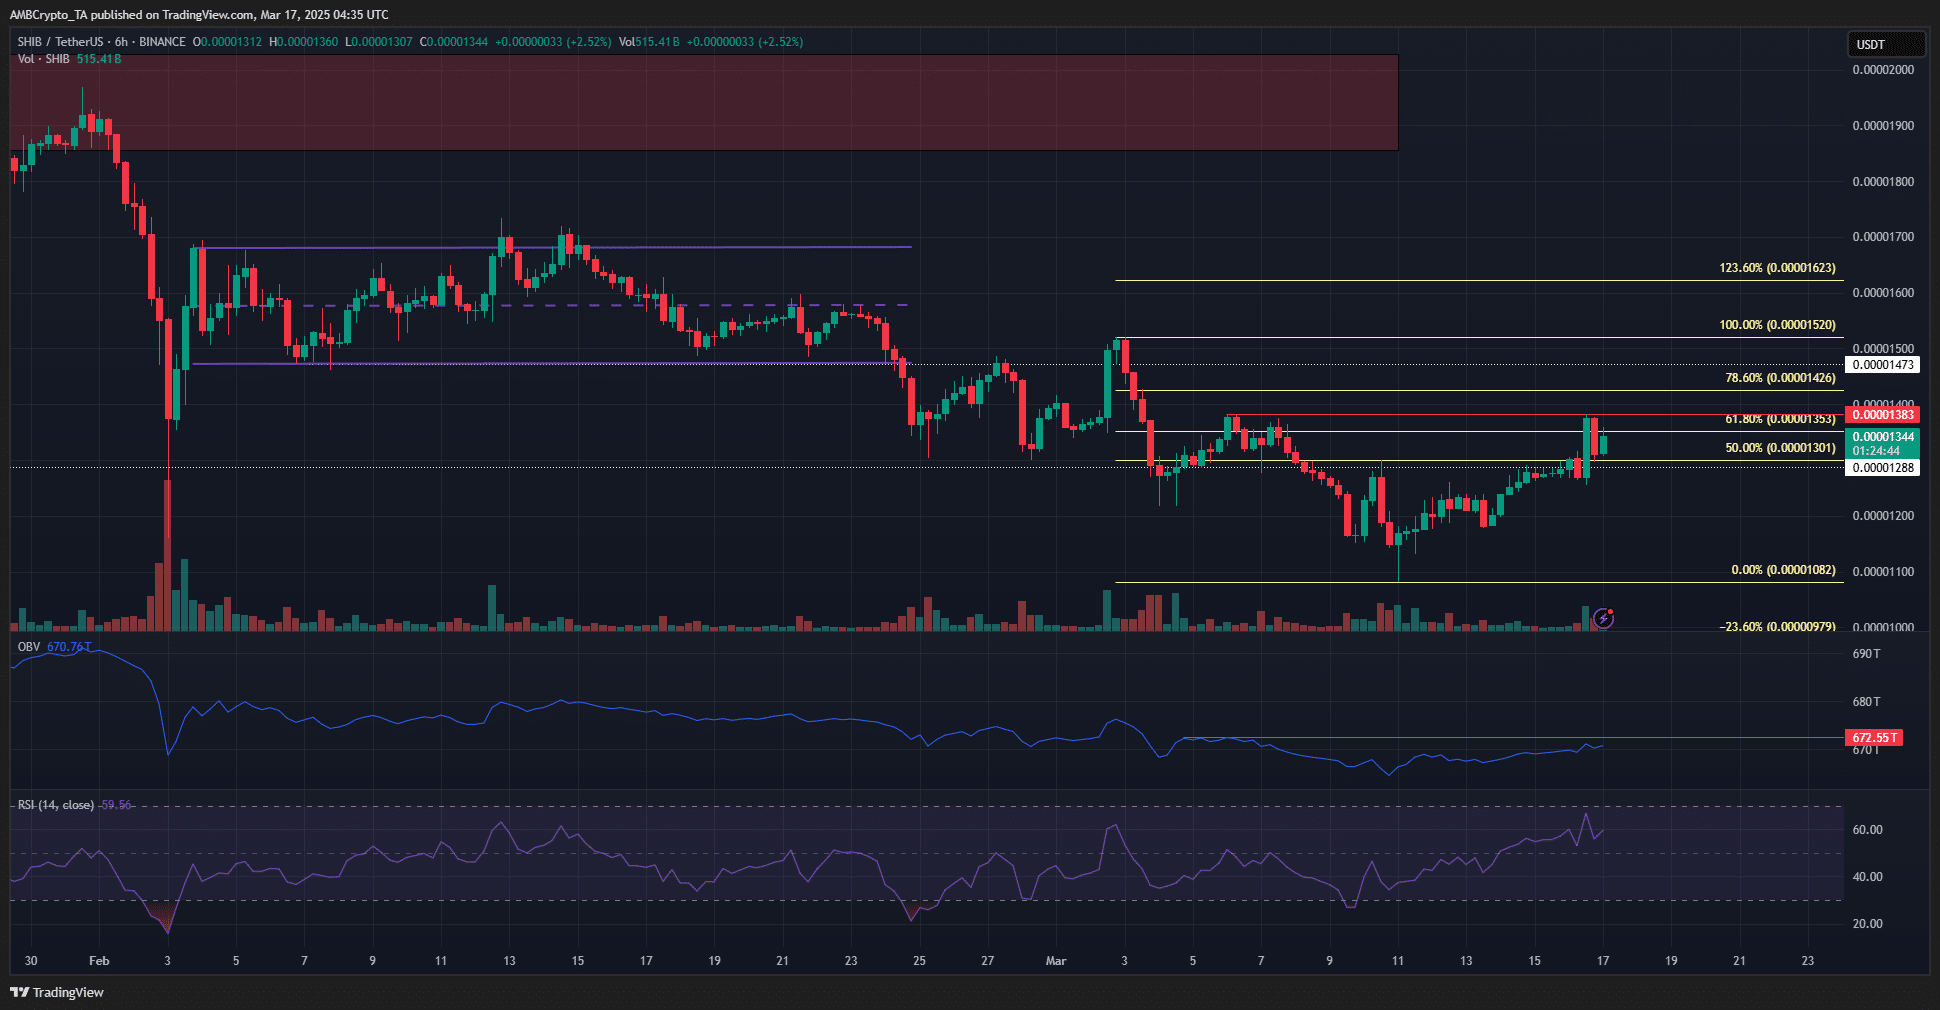
    The 6-hour chart showed SHIB trading near a local resistance at $0.0000138 (red). The OBV failed to set a higher high compared to earlier this month.

    Additionally, Fibonacci retracement levels identified $0.0000135 and $0.0000142 as key short-term resistance zones.

    This suggests SHIB is unlikely to rise more than 6% from its current price. The RSI reflected bullish momentum following last week’s gains, but the swing structure on the 6-hour chart remained bearish.

    A breakout above $0.0000127 and its retest as support fueled recent gains. Similarly, a move above $0.0000152 could drive the next leg higher. However, the weekly chart does not indicate such a breakout is imminent.

    Disclaimer: The information presented does not constitute financial, investment, trading, or other types of advice and is solely the writer’s opinion

    Next: Bitcoin Reserve? South Korea joins Japan, Switzerland in…

    Follow on Google News Follow on Flipboard
    Share. Facebook Twitter Pinterest LinkedIn Tumblr Email Copy Link
    Previous ArticleShiba Inu Gains 1.47% in 24 Hours, $SOL All Set to Break Resistance Level and Gain Bullish Momentum
    Next Article Ethena Labs and Securitize Launches Converge, An EVM Blockchain for Institutional DeFi
    Avatar
    Yeek.io
    • Website

    Yeek.io is your trusted source for the latest cryptocurrency news, market updates, and blockchain insights. Stay informed with real-time updates, expert analysis, and comprehensive guides to navigate the dynamic world of crypto.

    Related Posts

    Dogecoin faces a sell wall – Will smart money hold or fold at $0.17?

    June 7, 2025

    Analyzing Dogecoin’s price recovery odds in the wake of Trump-Musk spat

    June 7, 2025

    Examining PENGU’s 9% pump – Will spot sell pressure ruin the bullish setup?

    June 7, 2025
    Leave A Reply Cancel Reply

    Advertisement
    Demo
    Latest Posts

    Ethereum Prepares For A Parabolic Move – ETH/BTC Chart Signals Strong Bullish Setup

    Ethereum Enters Strategic Pause: Will Accumulation Below Resistance Spark A Surge?

    Solana indicators point north, bulls test $165 target

    Cardano is at the Nexus of Bitcoin DeFi: Charles Hoskinson

    Popular Posts
    Advertisement
    Demo
    X (Twitter) TikTok Instagram

    Categories

    • Altcoin
    • Bitcoin
    • Blockchain
    • Crypto News

    Categories

    • Defi
    • Ethereum
    • Meme Coins
    • Nfts

    Quick Links

    • Home
    • About
    • Contact
    • Privacy Policy

    Important Links

    • Crypto Chart
    • Crypto Price Chart
    © 2025 Yeek. All Copyright Reserved

    Type above and press Enter to search. Press Esc to cancel.