
- SAND’s bullish pennant breakout targets $1, supported by strong price action above $0.62.
- Reduced exchange reserves and bullish on-chain metrics strengthened the case for upward price momentum.
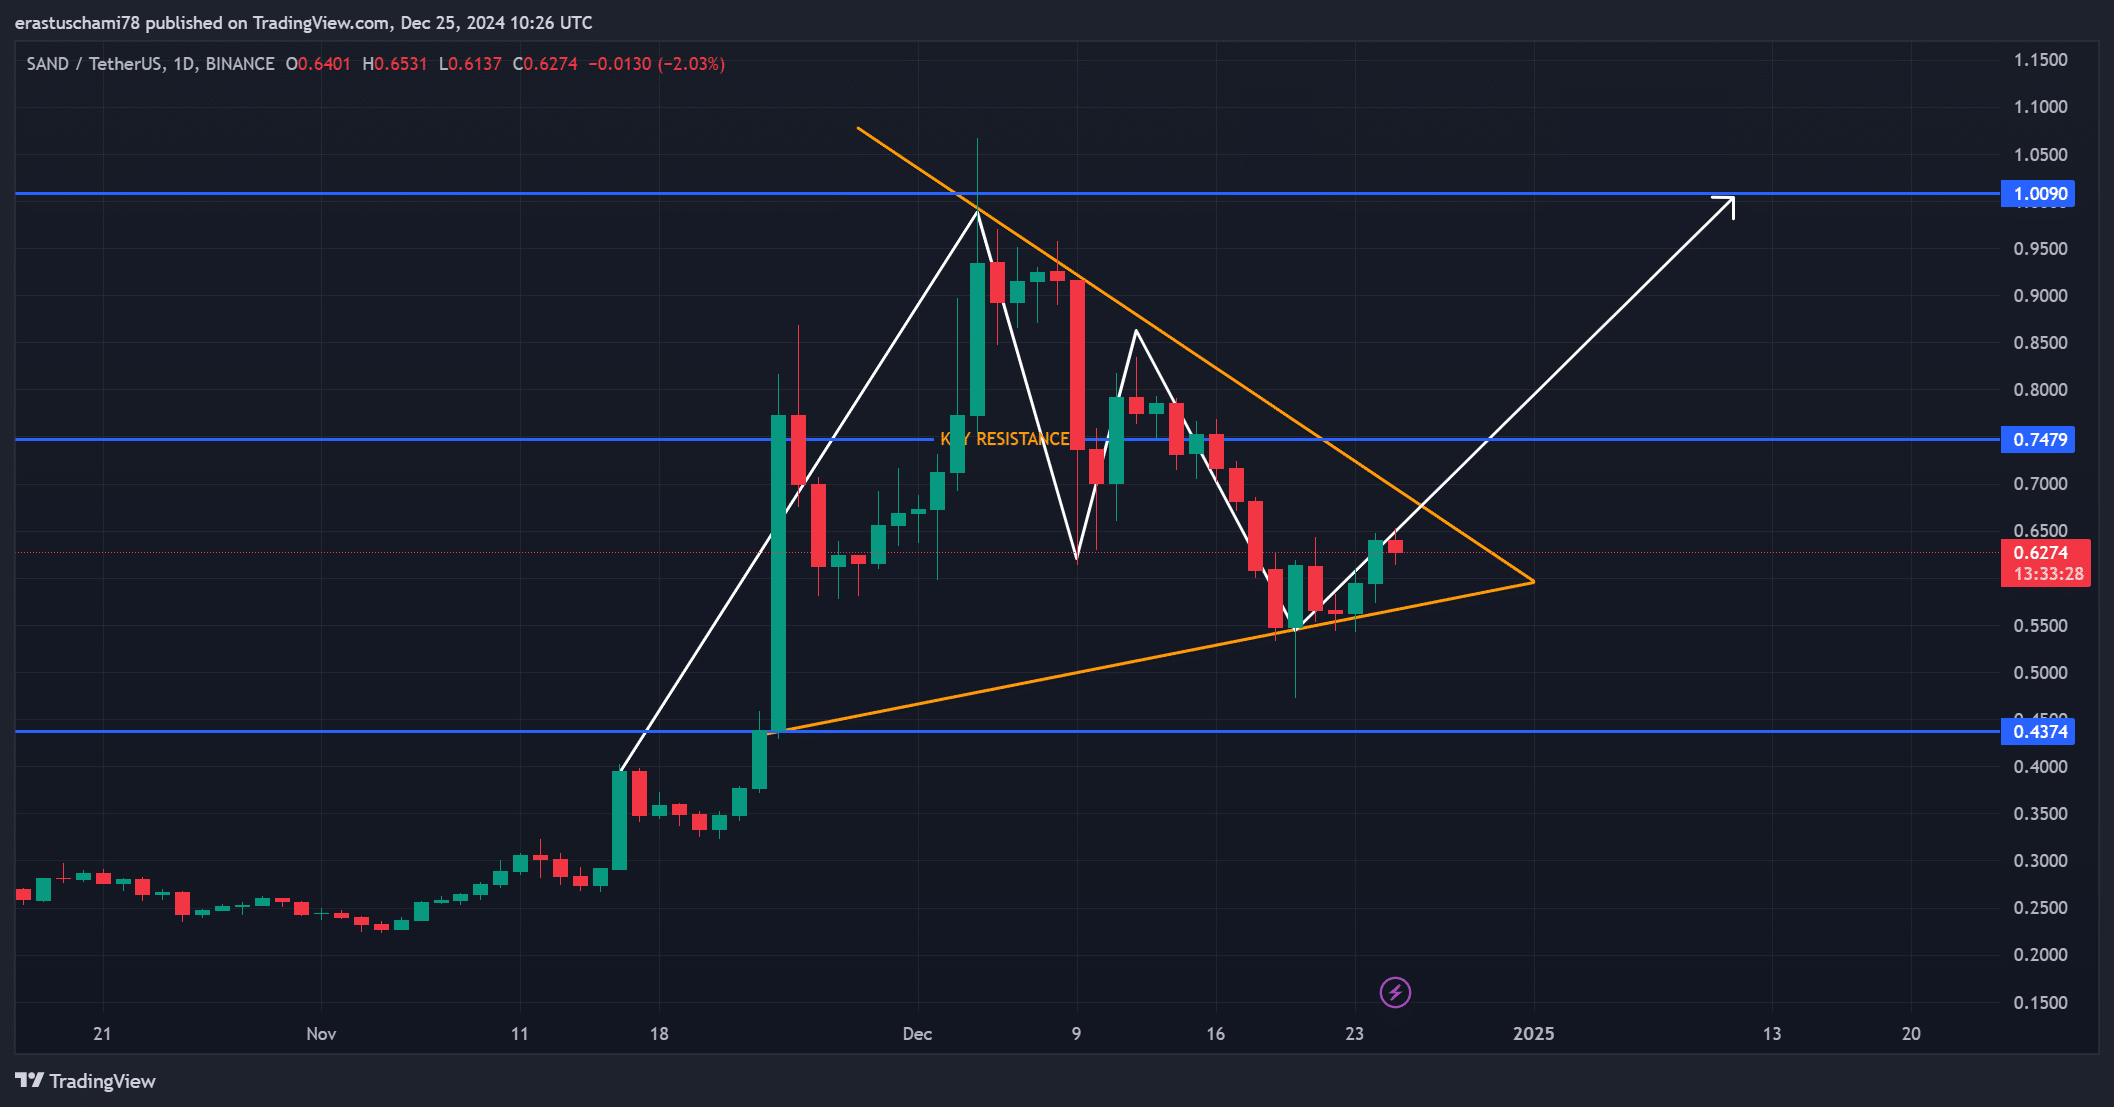
The Sandbox [SAND] has sparked optimism among traders as it broke above a critical resistance at $0.62, forming a bullish pennant on the daily chart.
This breakout suggested a potential rally to the $1 mark, driven by increasing market momentum and improving on-chain activity.
At press time, SAND was trading at $0.6308, reflecting an 8.60% gain in the last 24 hours. However, the price faces upcoming resistance levels that could challenge its ability to sustain this upward move.
SAND price action analysis
SAND’s recent price movement has demonstrated consistent respect for the bullish pennant pattern, confirming $0.62 as a pivotal level.
The breakout above this resistance has triggered buying interest, indicating potential for upward continuation.
Therefore, the next key target for SAND lies at $0.75, with $1.00 being the psychological level to watch.
On the downside, a correction could see support at $0.43 being tested, particularly if bullish momentum falters. Additionally, traders should monitor for consolidation, which may precede another breakout.
On-chain signals highlight growing interest
On-chain metrics further bolster SAND’s bullish outlook. Net network growth has risen by 0.30%, signaling steady user adoption, while 0.83% of holders are now “in the money,” reflecting profitable positions.
However, concentration of large holders has slightly declined by 0.04%, indicating minor profit-taking activity.
Additionally, large transactions have surged by 10.96%, showcasing heightened activity among institutional traders.
These metrics suggest growing interest, but the slight dip in concentration highlights the importance of monitoring distribution trends closely.
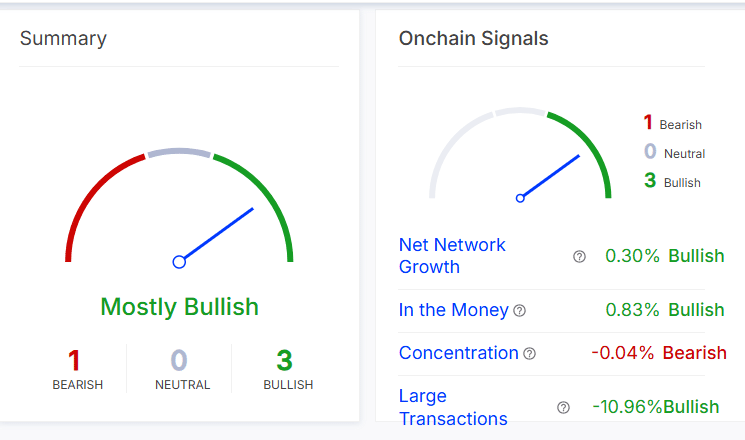
Source: IntoTheBlock
Technical indicators align with bullish outlook
Technical indicators provided additional confirmation of SAND’s upward potential. The RSI was 49 at press time, indicating neutral momentum with a bullish tilt.
Additionally, Bollinger Bands are narrowing, signaling a potential breakout as price volatility compresses.
If SAND sustains this momentum, an explosive move upward could follow. However, failure to maintain support above $0.62 may lead to a temporary retracement before another attempt at resistance levels.
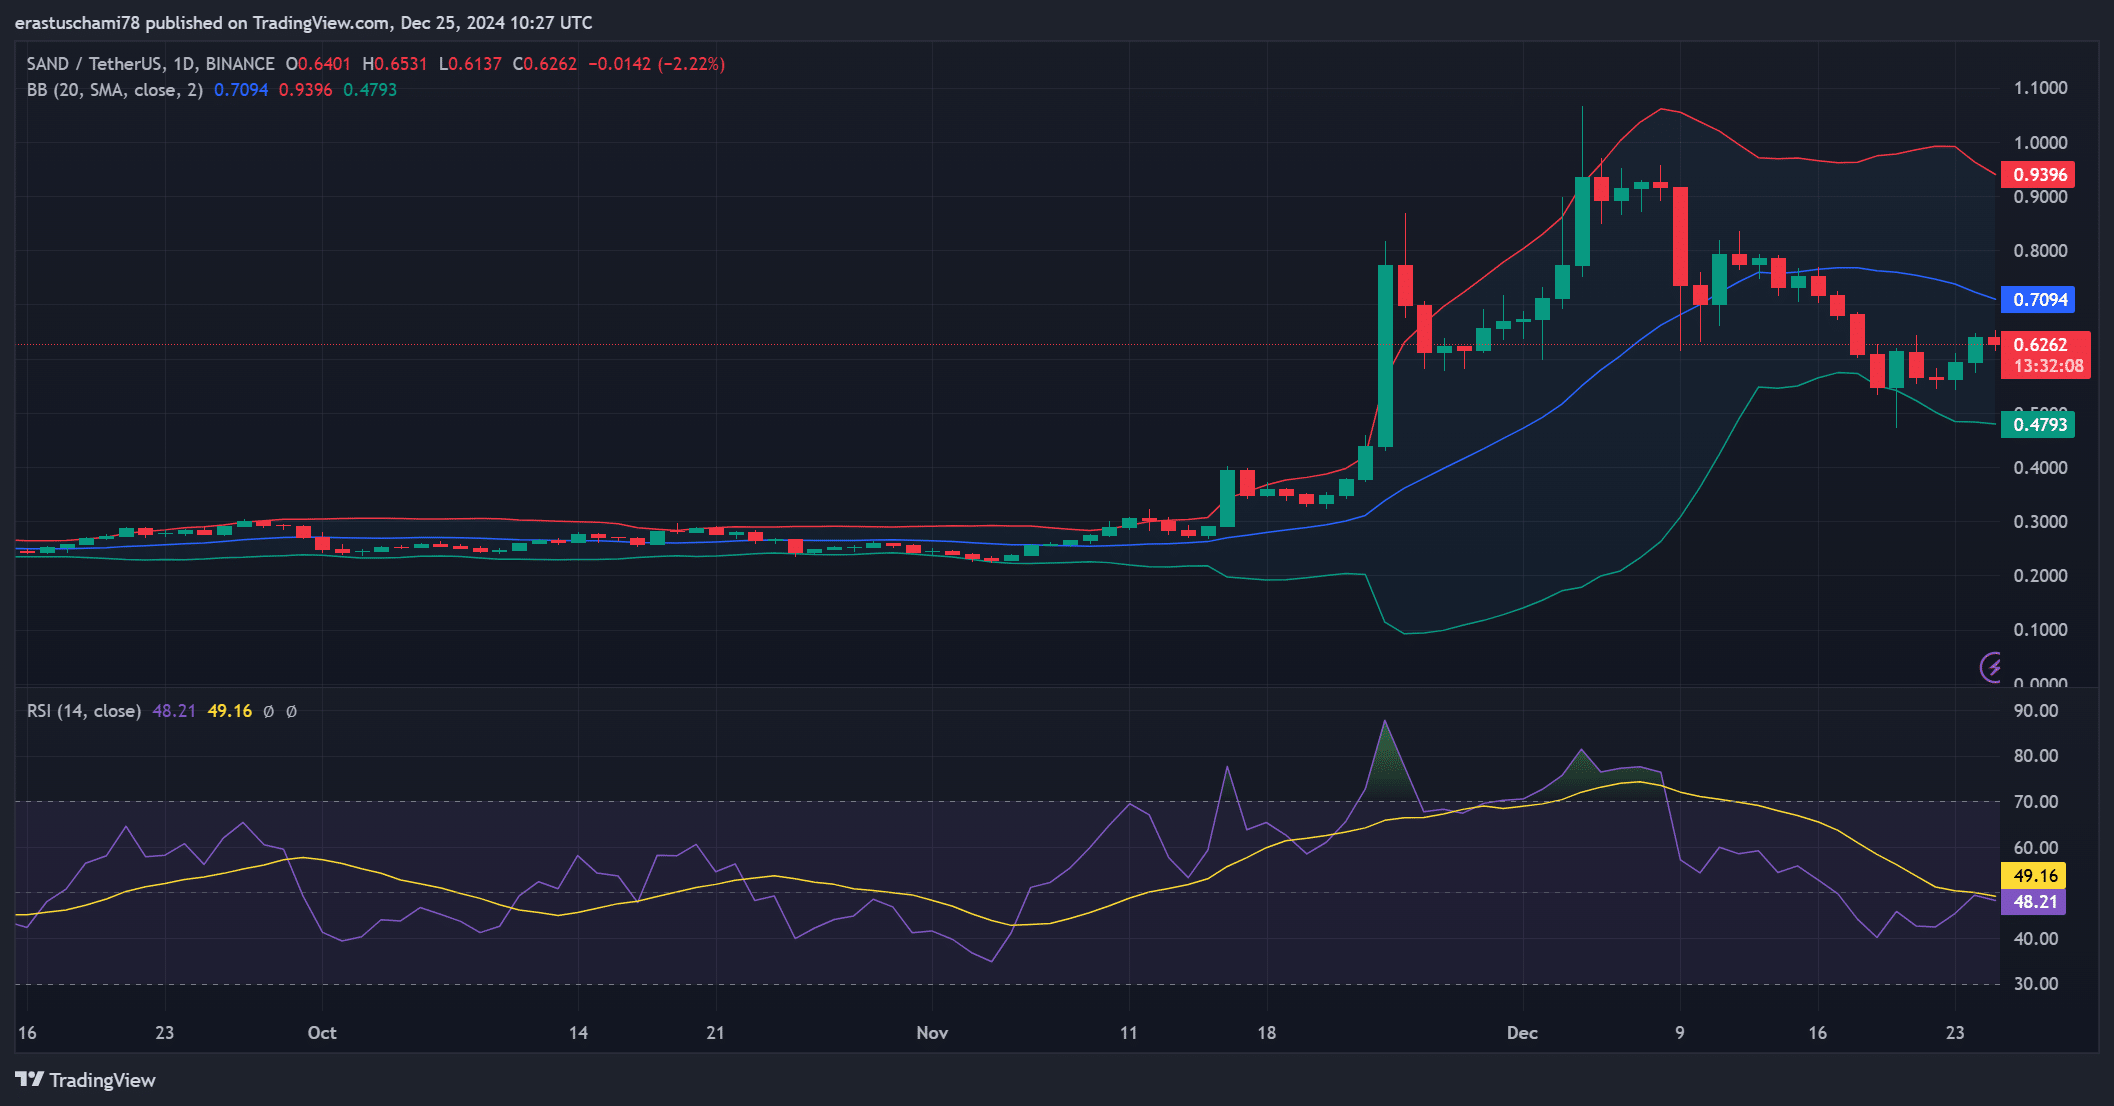
Source: TradingView
Exchange reserve analysis signals reduced selling pressure
Exchange reserve data painted a bullish picture, with a 1.51% drop in SAND’s reserves over the last 24 hours. This decline indicates that fewer tokens are available for trading, as holders move coins off exchanges.
Additionally, reduced supply on exchanges often diminishes selling pressure, providing a favorable environment for price increases.
Therefore, continued decreases in reserves could further support the ongoing rally.
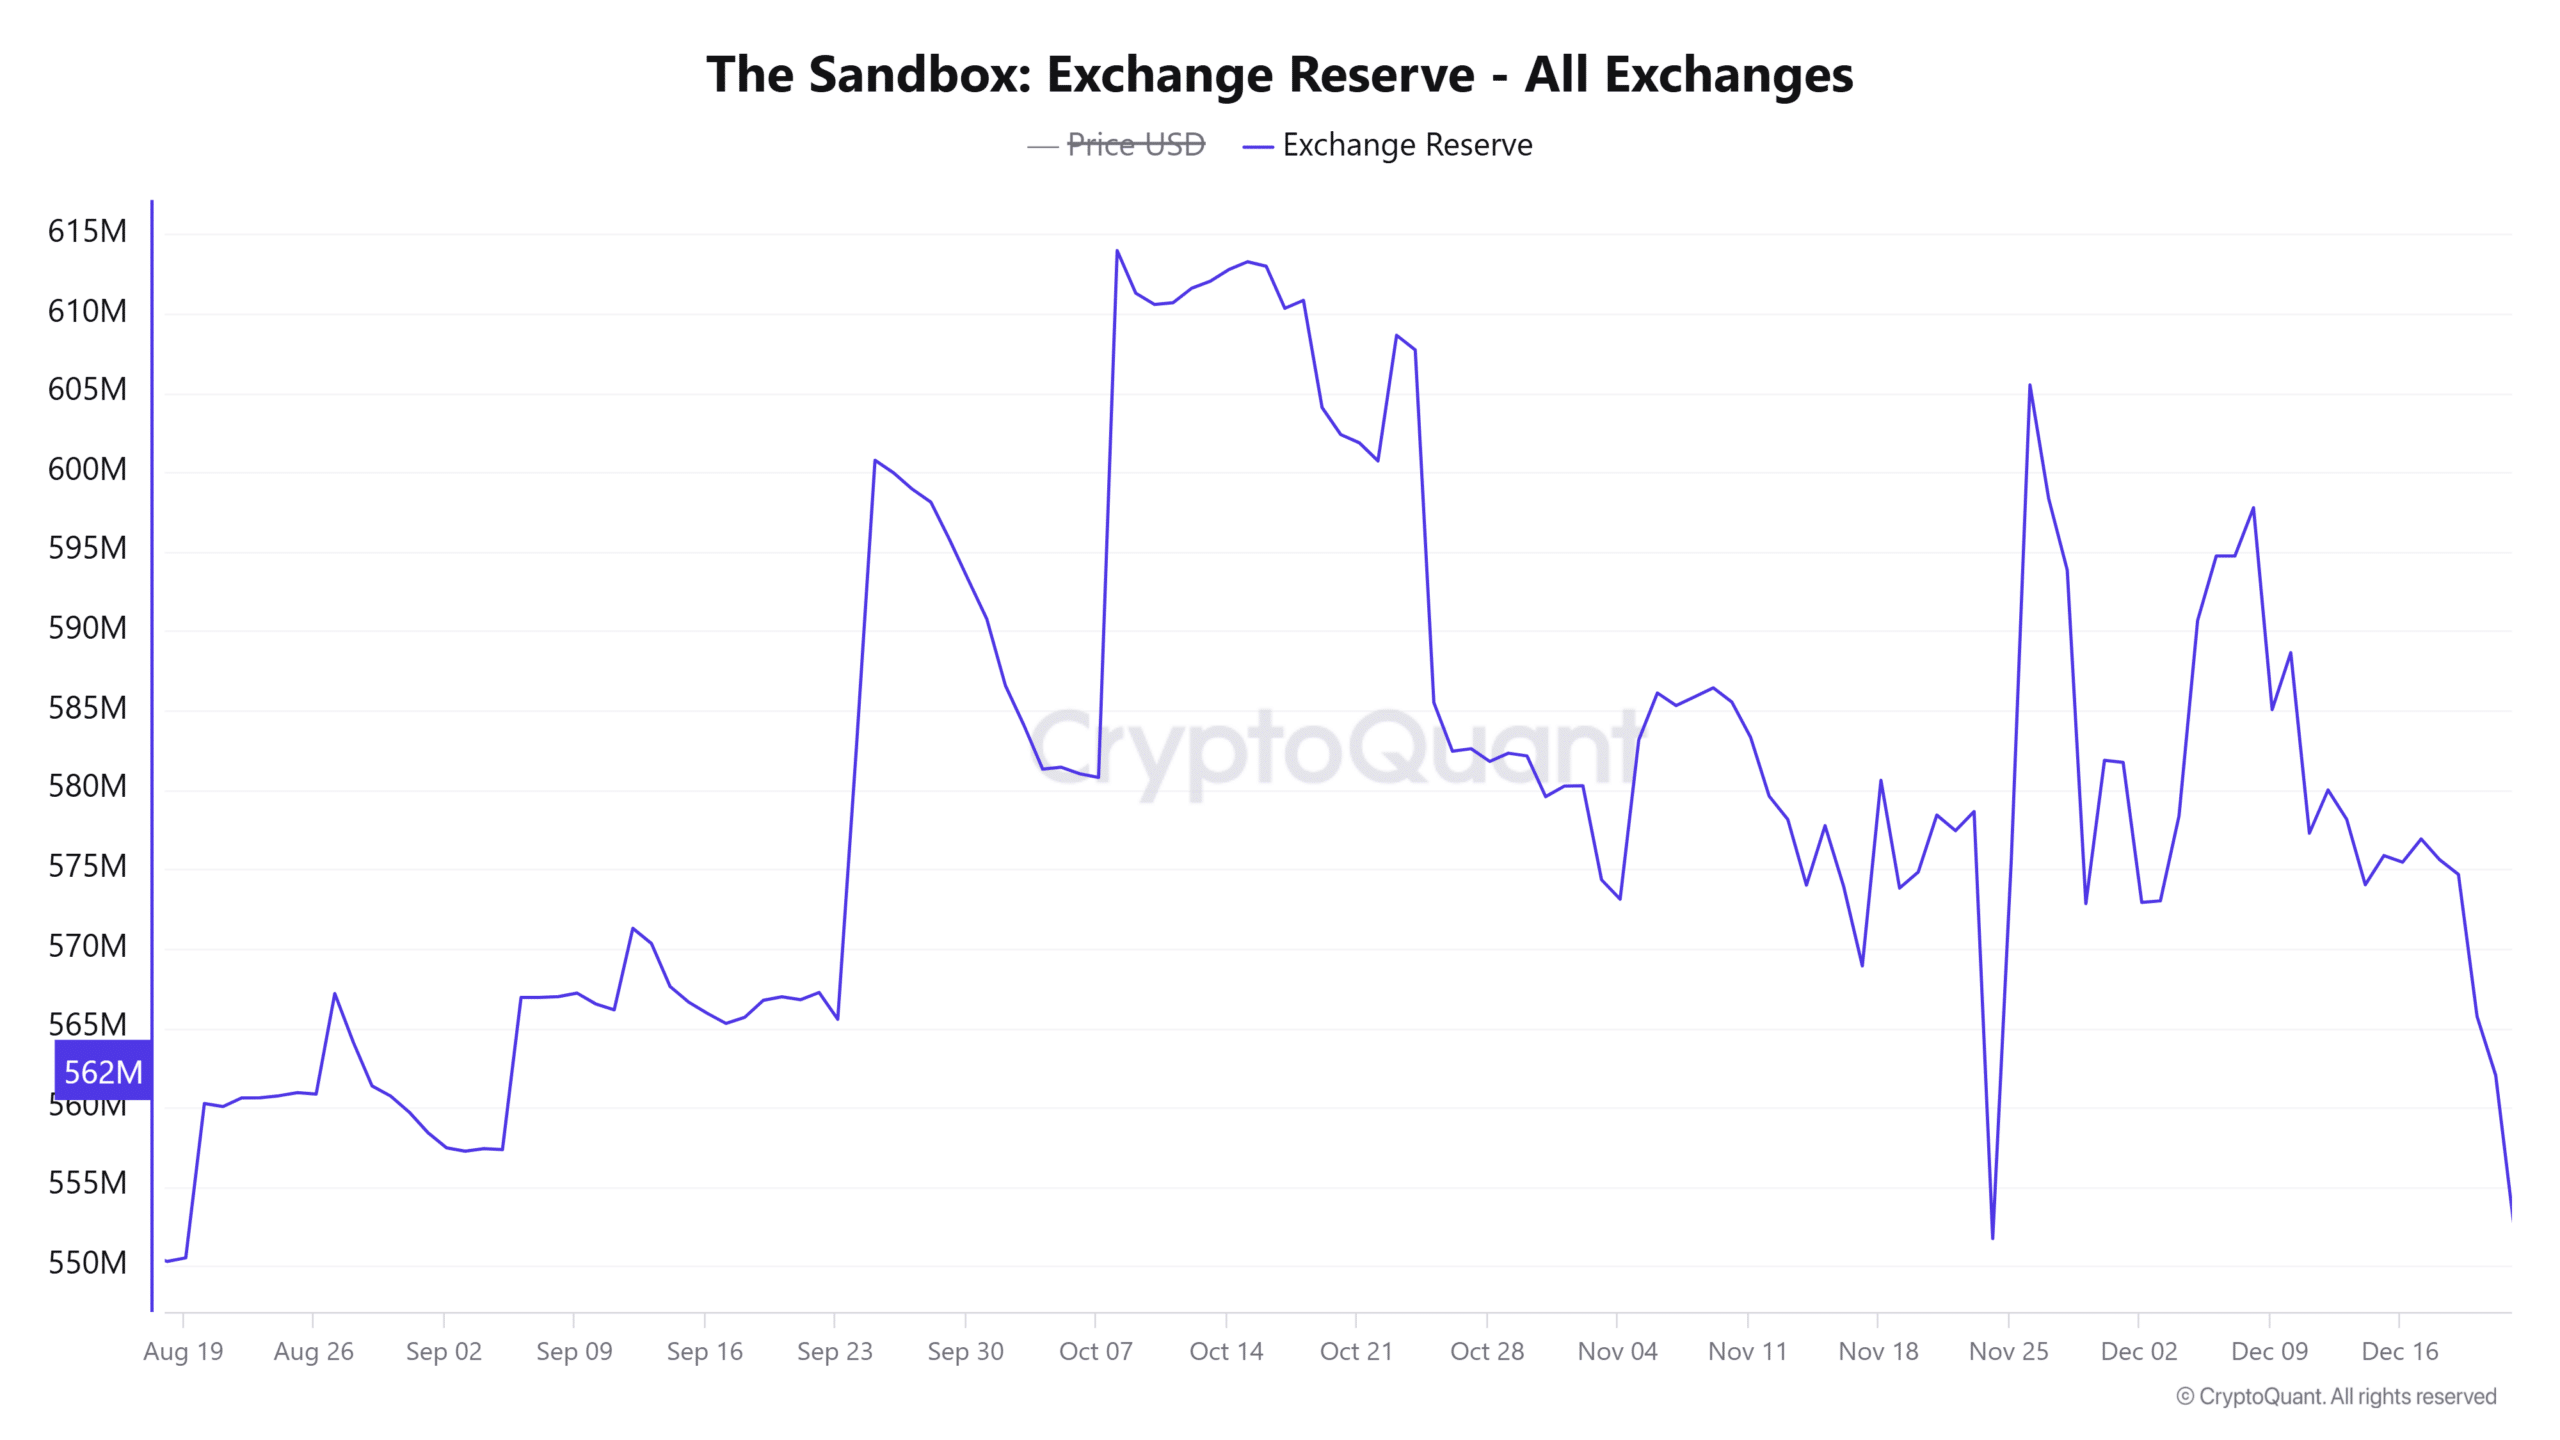
Source: CryptoQuant
Is your portfolio green? Check out the SAND Profit Calculator
Can SAND reach $1?
SAND has strong potential to reach $1.00, supported by its bullish pennant breakout, improving on-chain metrics, and reduced selling pressure.
However, sustaining this momentum will require overcoming key resistance levels and maintaining broader market optimism. The next few days will be critical in determining SAND’s trajectory.