Close Menu
    What's Hot

    Shiba Inu’s deflation drive stalls – But before you buy the dip, look out for…

    US Ethereum ETFs Record 4 Consecutive Weeks Of Positive Inflows — Details

    Here’s why Sonic erased $1.3 billion in value

    Facebook X (Twitter) Instagram
    yeek.io
    • Crypto Chart
    • Crypto Price Chart
    X (Twitter) Instagram TikTok
    Trending Topics:
    • Altcoin
    • Bitcoin
    • Blockchain
    • Crypto News
    • DeFi
    • Ethereum
    • Meme Coins
    • NFTs
    • Web 3
    yeek.io
    • Altcoin
    • Bitcoin
    • Blockchain
    • Crypto News
    • DeFi
    • Ethereum
    • Meme Coins
    • NFTs
    • Web 3
    Crypto News

    This Bitcoin Price Range Could Be The Bulls’ Final Defense Line, Report Says

    Yeek.ioBy Yeek.ioMarch 7, 2025No Comments4 Mins Read
    Share Facebook Twitter Pinterest Copy Link Telegram LinkedIn Tumblr Email
    Share
    Facebook Twitter LinkedIn Pinterest Email

    Este artículo también está disponible en español.

    A report from the on-chain analytics firm Glassnode has revealed a Bitcoin price region that could prove to be crucial for the bulls.

    Several Key Bitcoin Metrics Are Pointing At The Same Price Range Right Now

    In its latest weekly report, Glassnode has discussed the Bitcoin investor cost basis from various angles. The first indicator that the analytics firm has shared is the “UTXO Realized Price Distribution” (URPD), that basically tells us about how the BTC supply is distributed among the different price levels based on the last transaction value.

    Related Reading

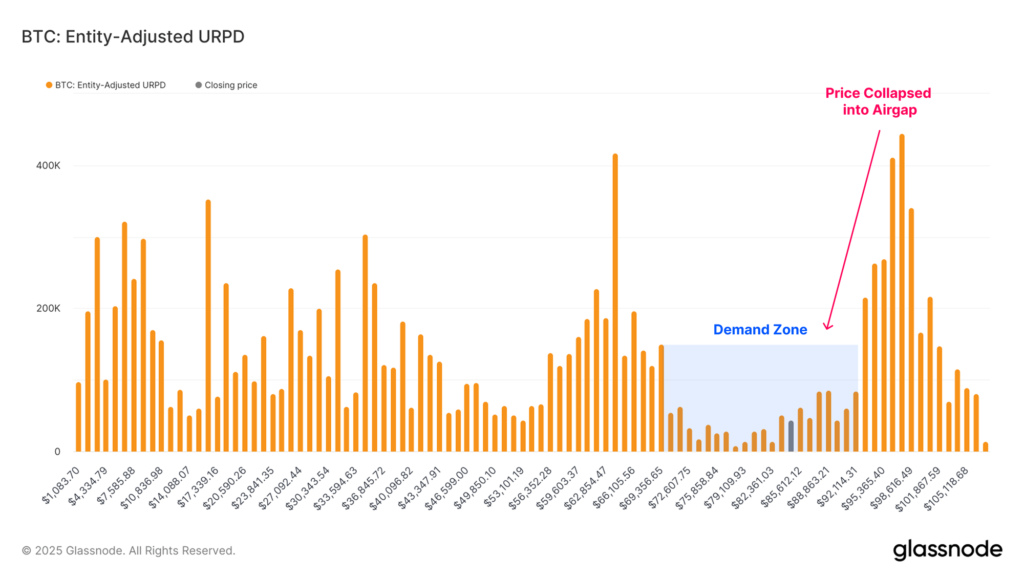
    First, here is how this metric looked before the recent price crash:

    The BTC URPD as it stood prior to the price drawdown | Source: Glassnode’s The Week Onchain – Week 9, 2025

    As is visible in the chart, very few coins had their cost basis between $70,000 and $92,000 before the crash. In on-chain analysis, investor cost basis is considered an important topic, as holders are more likely to make some kind of move when their profit-loss status is threatened. Since this range contained the acquisition level of only a small part of the supply, it was sort of an “air-gap” in terms of potential demand.

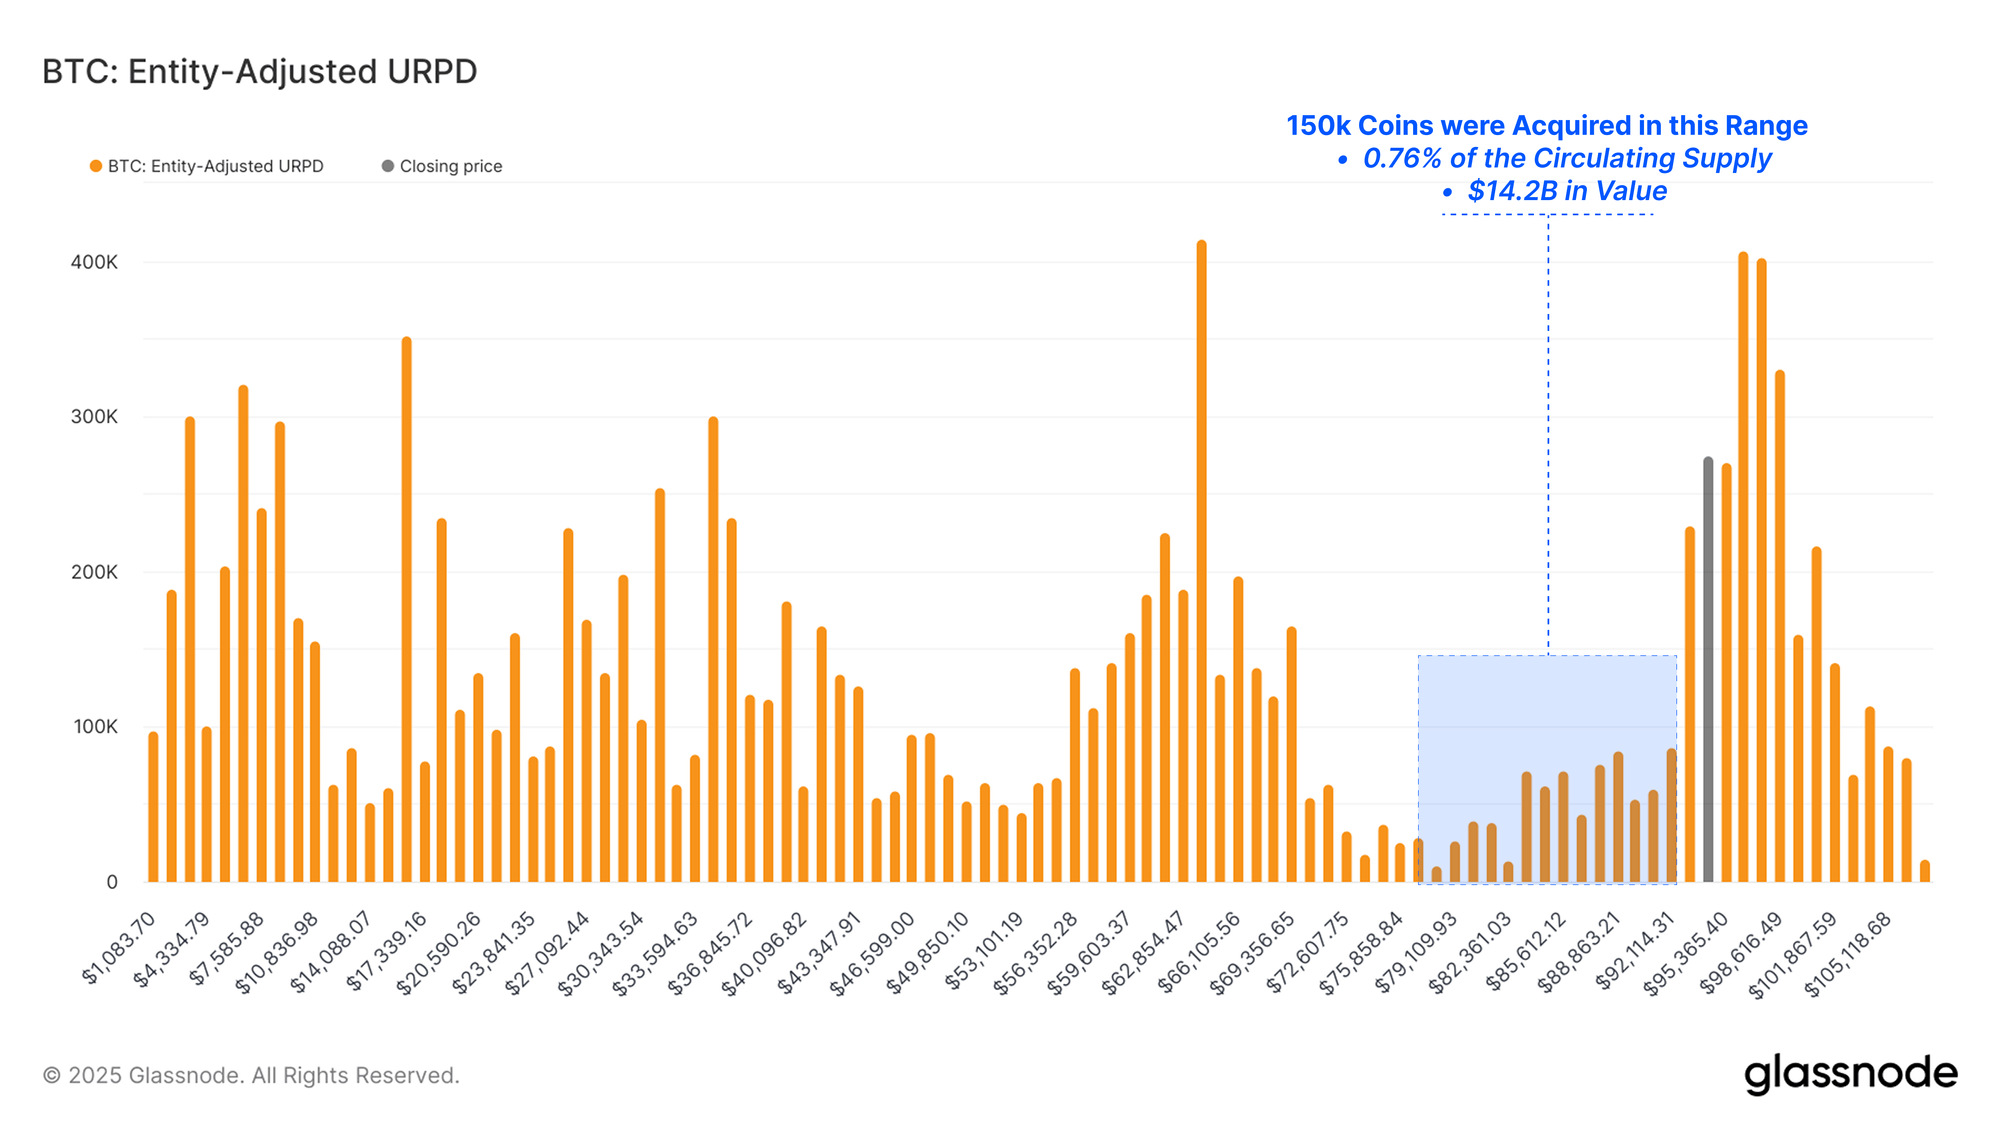
    This may be why BTC easily slipped deep into this region when the crash came. So far, though, the bulls have come through in providing support, as they have since participated in some buying in this vacant region, changing the URPD.
    Bitcoin Accumulation
    It would appear that the investors have purchased 150,000 BTC inside the air-gap region | Source: Glassnode’s The Week Onchain – Week 9, 2025

    Thus, the range is now better set up to provide support than before, although it’s still sort of an empty region when compared to the other Bitcoin cost basis centers.

    The second indicator that Glassnode has talked about is the Realized Price of the short-term holders. The “Realized Price” is a term that was also in the full form of URPD. What this metric measures is the cost basis of the average investor belonging to a part of the BTC userbase.

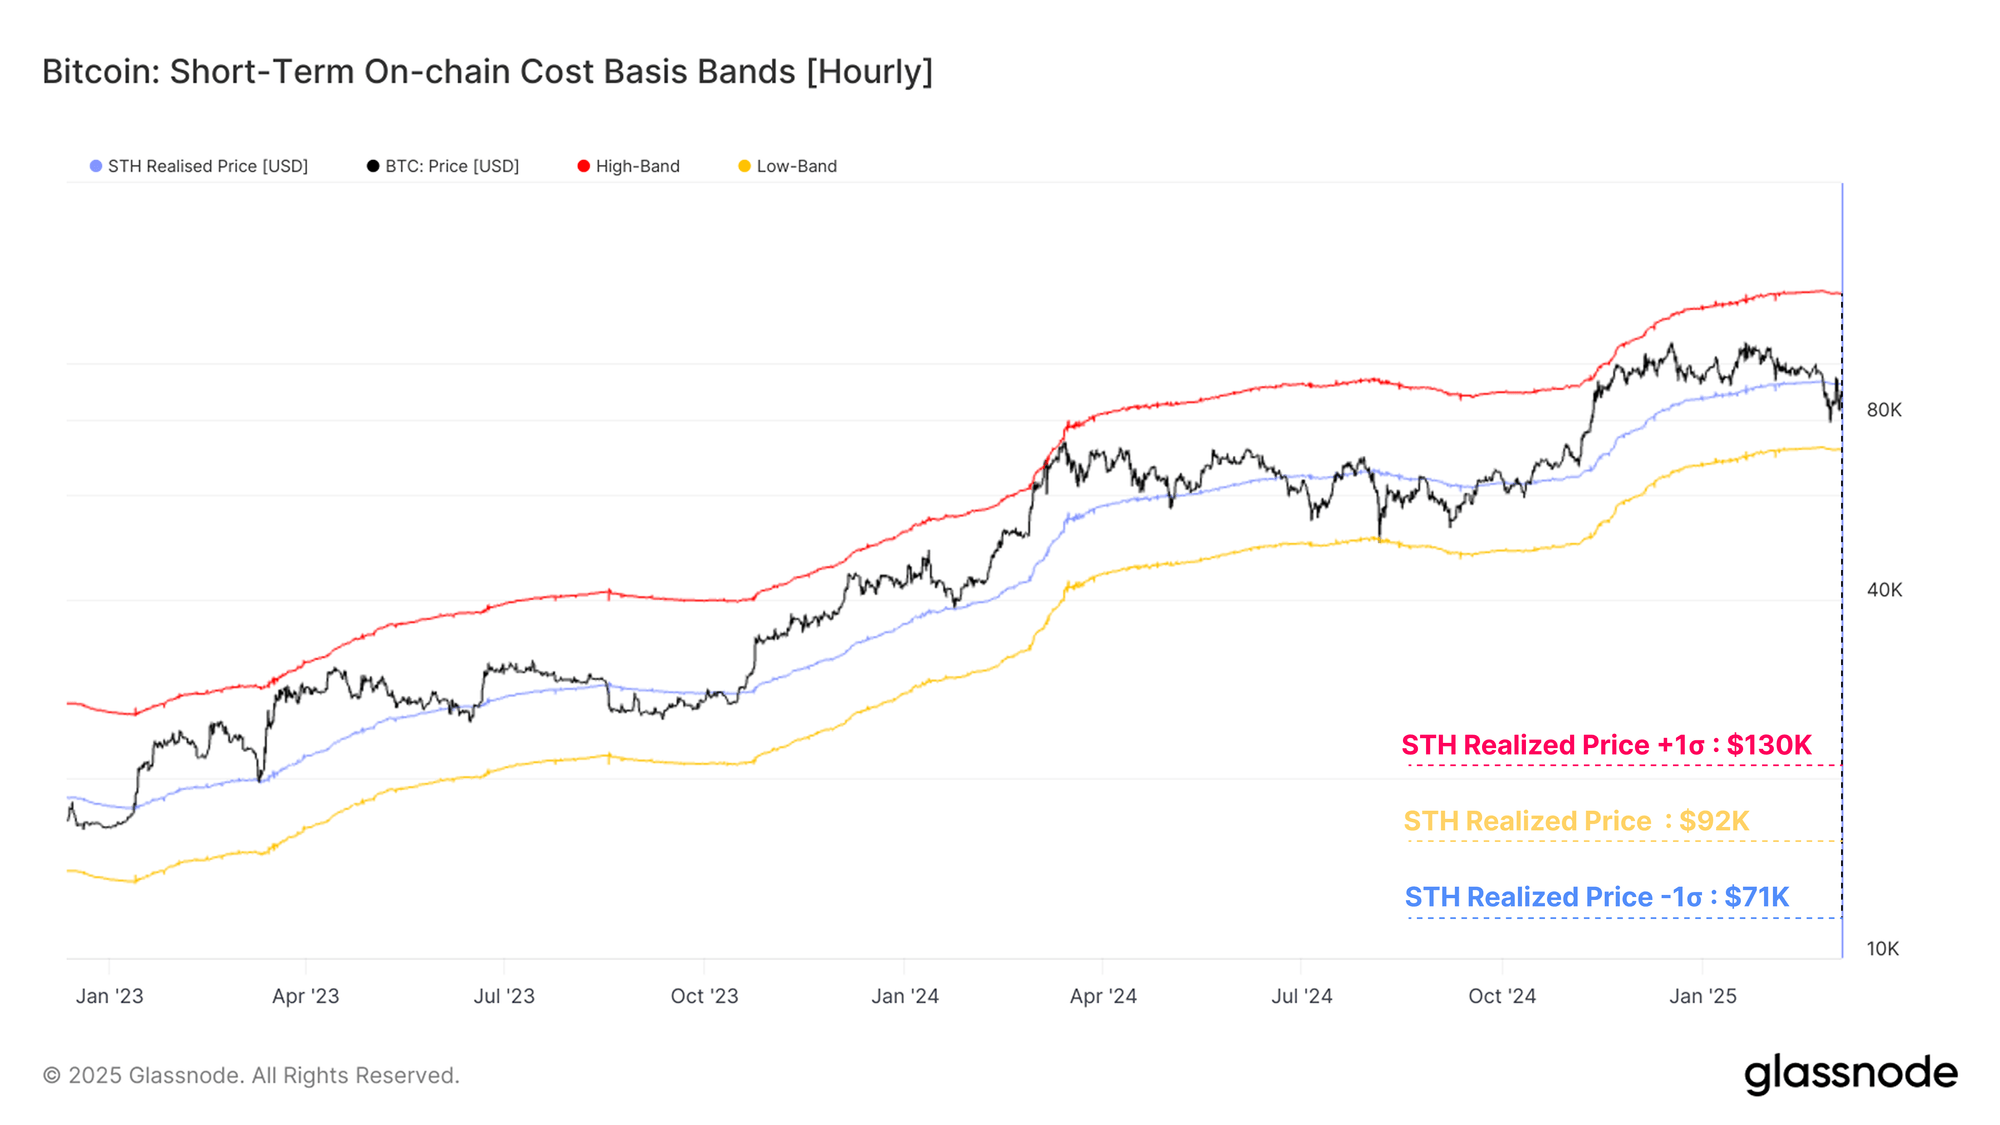
    Below is a chart that shows the trend in the indicator for the short-term holders (STHs), who are the Bitcoin investors who purchased their coins within the past 155 days.
    Bitcoin STH Realized Price
    The trend in the STH Realized Price and its two deviation bands | Source: Glassnode’s The Week Onchain – Week 9, 2025

    “The Short-Term Holder cost basis has historically acted as an important reference level across bull-market uptrends,” notes the analytics firm. “We have calculated the ±1σ bands of the Short-Term Holder Cost-Basis, which have typically acted as a sort of upper and lower bound for local price action.”

    Interestingly, this lower bound, that is, the level one standard deviation below the STH Realized Price, is situated at $71,000 right now. This is about the same level as where the previously mentioned air-gap area ends.

    Related Reading

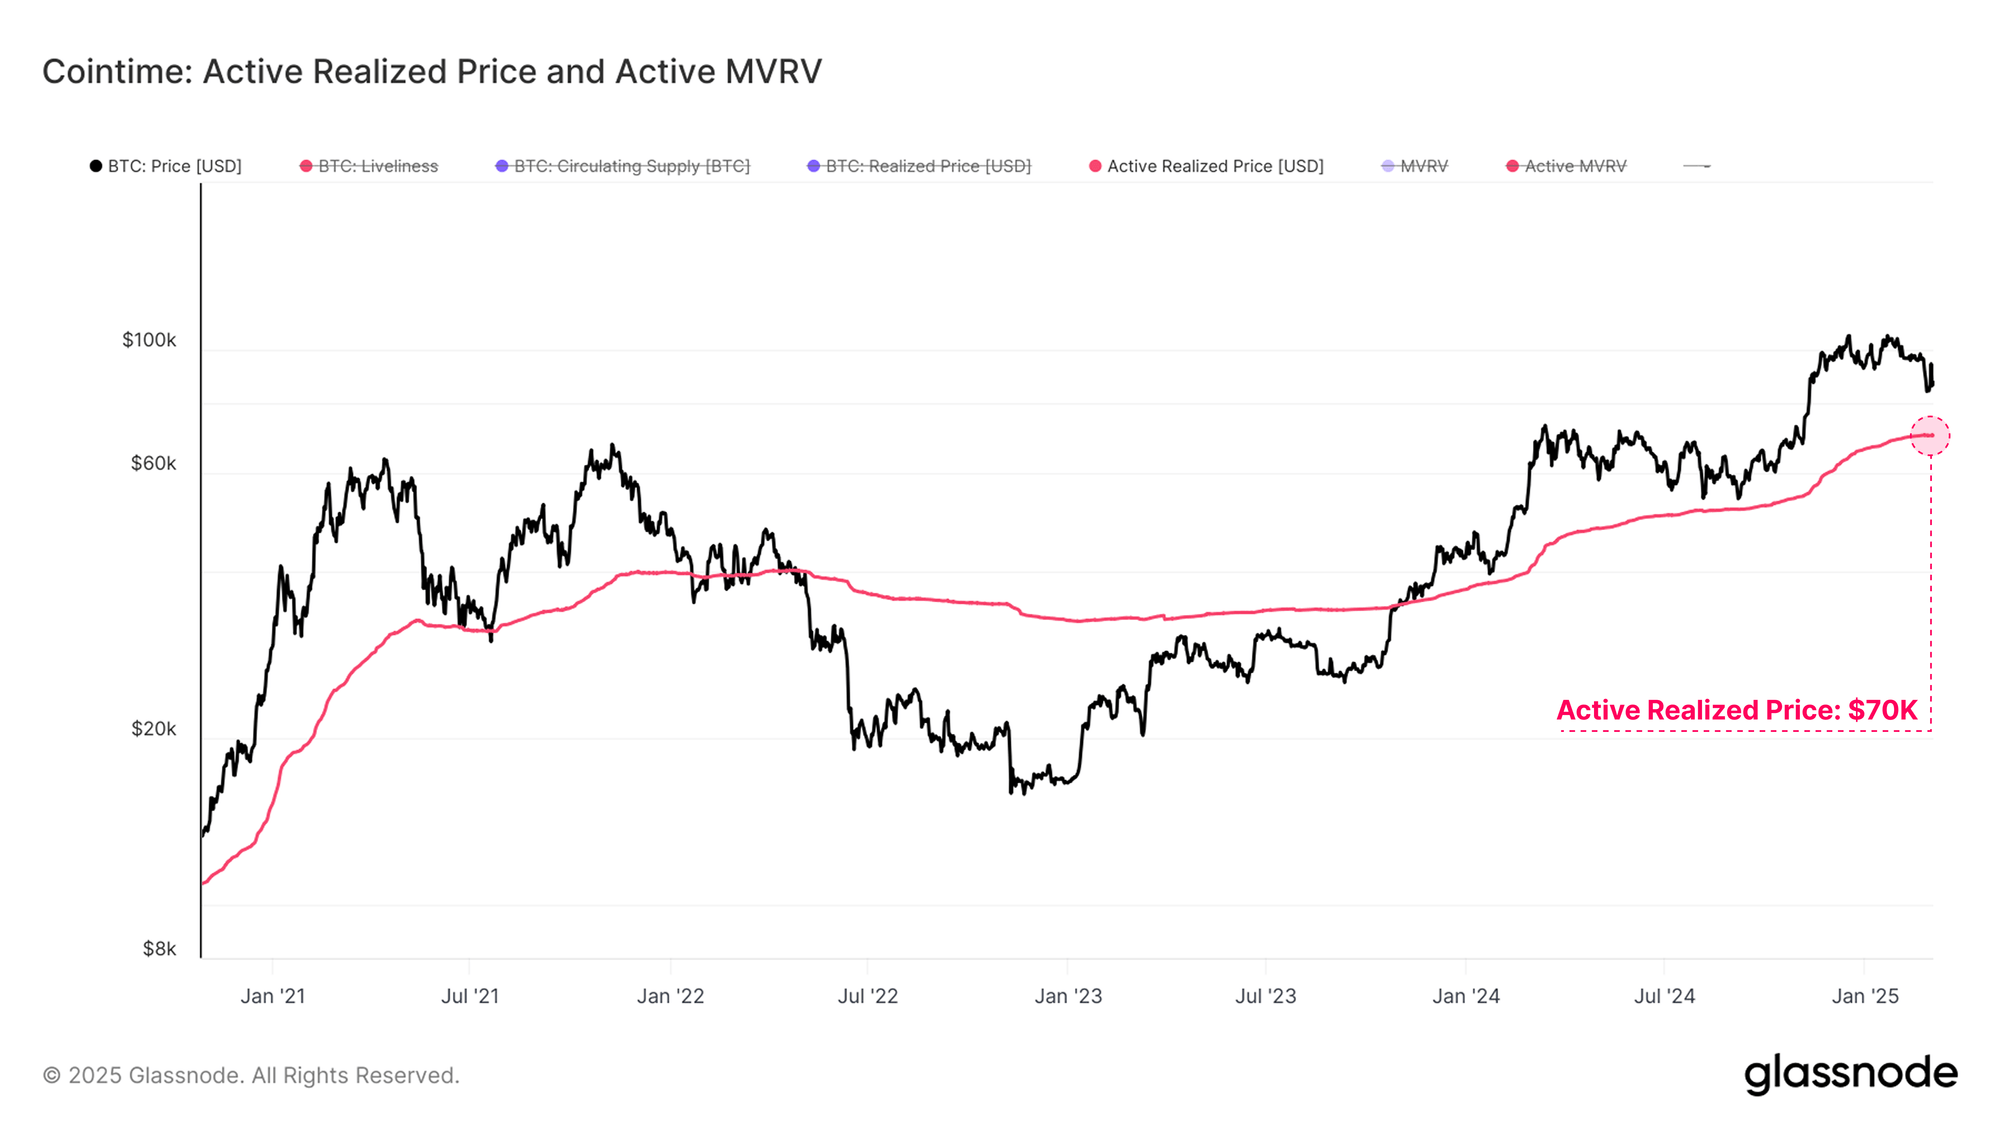
    This isn’t the only other place where this level shows up, as the chart for the Active Realized Price shows.
    Bitcoin Active Realized Price
    Looks like BTC is currently trading a decent distance above this line | Source: Glassnode’s The Week Onchain – Week 9, 2025

    The “Active Realized Price” basically takes the Realized Price of the entire BTC network, with an added twist. The metric only includes the ‘economical’ supply, meaning that it excludes for the part of the supply that Glassnode has determined to be unlikely to return back into circulation.

    At present, the Active Realized Price stands at $70,000, which is once again nearly the same level as the one from the other two indicators. “With significant confluence across several key cost basis metrics, this price region becomes an area of interest, perhaps being the final defence line for the bulls in the event of a complete capitulation,” concludes the report.

    BTC Price

    At the time of writing, Bitcoin is trading around $90,000, up almost 5% in the last week.

    Bitcoin Price Chart
    The price of the coin seems to have been on the way up during the last couple of days | Source: BTCUSDT on TradingView

    Featured image from Dall-E, Glassnode.com, chart from TradingView.com

    Follow on Google News Follow on Flipboard
    Share. Facebook Twitter Pinterest LinkedIn Tumblr Email Copy Link
    Previous ArticleAxie Infinity teases new Web3 game as NFT outlook turns positive
    Next Article Tokenized assets hit $50b, projected to reach $2T by 2030
    Avatar
    Yeek.io
    • Website

    Yeek.io is your trusted source for the latest cryptocurrency news, market updates, and blockchain insights. Stay informed with real-time updates, expert analysis, and comprehensive guides to navigate the dynamic world of crypto.

    Related Posts

    Darkweb actors claim to have over 100K of Gemini, Binance user info

    March 28, 2025

    Ethereum Sentiment Dips Among Retail Investors, Yet A Breakout Looms

    March 28, 2025

    ‘Our GPUs are melting’ — OpenAI puts limiter in after Ghibli-tsunami

    March 28, 2025
    Leave A Reply Cancel Reply

    Advertisement
    Demo
    Latest Posts

    Shiba Inu’s deflation drive stalls – But before you buy the dip, look out for…

    US Ethereum ETFs Record 4 Consecutive Weeks Of Positive Inflows — Details

    Here’s why Sonic erased $1.3 billion in value

    Whales lose SYRUP sweet tooth despite Maple Finance’s growth

    Popular Posts
    Advertisement
    Demo
    X (Twitter) TikTok Instagram

    Categories

    • Altcoin
    • Bitcoin
    • Blockchain
    • Crypto News

    Categories

    • Defi
    • Ethereum
    • Meme Coins
    • Nfts

    Quick Links

    • Home
    • About
    • Contact
    • Privacy Policy

    Important Links

    • Crypto Chart
    • Crypto Price Chart
    © 2025 Yeek. All Copyright Reserved

    Type above and press Enter to search. Press Esc to cancel.