Close Menu
    What's Hot

    Whales lose SYRUP sweet tooth despite Maple Finance’s growth

    Ethereum Prepares For A Parabolic Move – ETH/BTC Chart Signals Strong Bullish Setup

    Ethereum Enters Strategic Pause: Will Accumulation Below Resistance Spark A Surge?

    Facebook X (Twitter) Instagram
    yeek.io
    • Crypto Chart
    • Crypto Price Chart
    X (Twitter) Instagram TikTok
    Trending Topics:
    • Altcoin
    • Bitcoin
    • Blockchain
    • Crypto News
    • DeFi
    • Ethereum
    • Meme Coins
    • NFTs
    • Web 3
    yeek.io
    • Altcoin
    • Bitcoin
    • Blockchain
    • Crypto News
    • DeFi
    • Ethereum
    • Meme Coins
    • NFTs
    • Web 3
    Meme Coins

    TRUMP starts to struggle – Will bears drag it further down to $9.54?

    Yeek.ioBy Yeek.ioMarch 17, 2025No Comments2 Mins Read
    Share Facebook Twitter Pinterest Copy Link Telegram LinkedIn Tumblr Email
    Share
    Facebook Twitter LinkedIn Pinterest Email
    • Official Trump showed signs of forming a short-term range formation below $12.2.
    • The OBV showed that selling pressure had begun to increase in recent hours.

    The short-term performance of Official Trump [TRUMP] has been uninspiring. Since reaching the local resistance around $12.5 on the 15th of March, TRUMP receded by 10.55% and was trading at $11.19 at press time.

    Mondays tend to see heightened volatility and can set the tone for the week’s price trends. AMBCrypto examined the liquidation heatmaps of Official Trump to understand what the next short-term trends could be.

    Is TRUMP forming a range below $12.2?

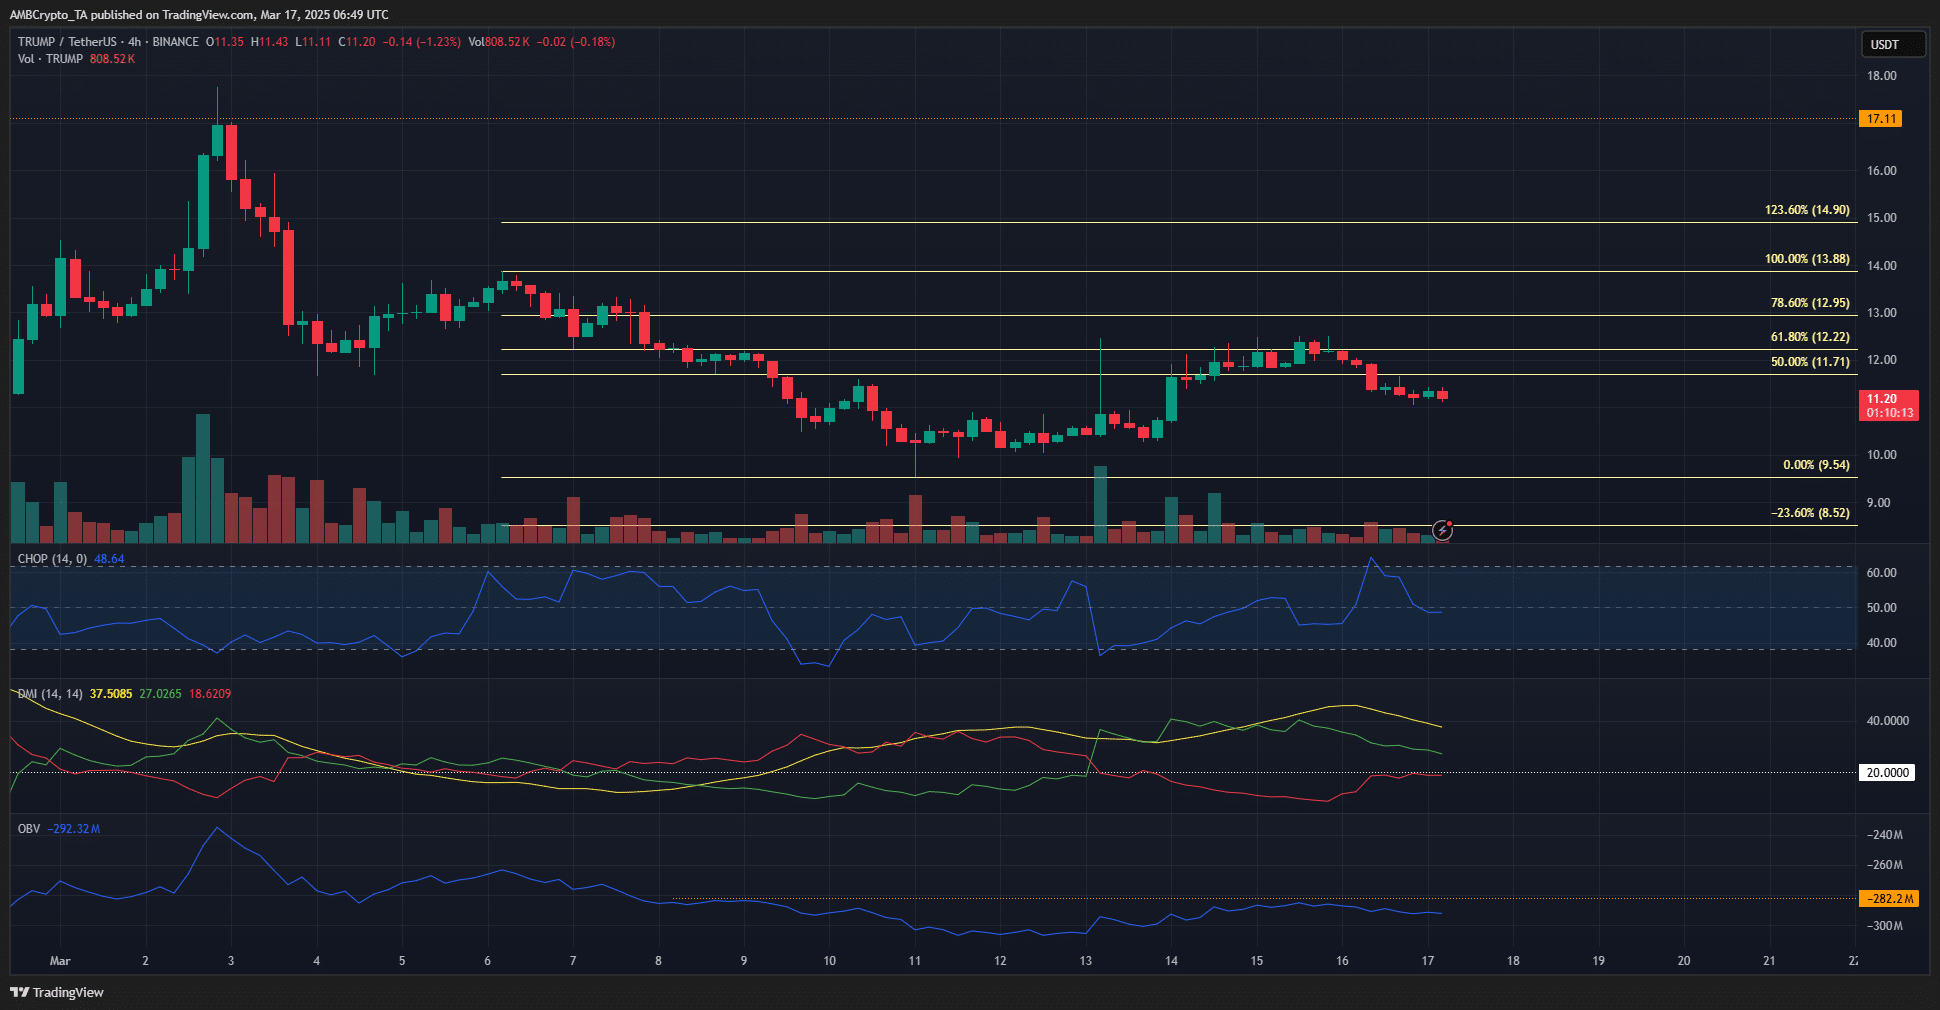
    TRUMP 4-hour Chart

    Source: TRUMP/USDT on TradingView

    Based on the downward move from $13.88 to $9.54 earlier this month, a set of Fibonacci retracement levels were plotted. They showed that the 61.8% retracement level was at $12.22.

    This level had served as resistance in the past four days.

    The memecoin didn’t set a convincing higher high, and neither did the OBV. Together, they showed that the buyers lacked strength. The $10.2 was a good short-term support level in the past week.

    It could be retested once again, leading to a range formation for Official Trump.

    The choppiness index fell in recent hours to show a trend was materializing. The DMI differed in its findings, showing that a strong bullish trend has been in place since the 13th of March.

    Unless the OBV moves higher again, the short-term uptrend would likely remain standing.

    If the $10.2 level is retested in the coming days but can not be defended as support, the $9.54 and $8.52 levels were the next bearish price targets.
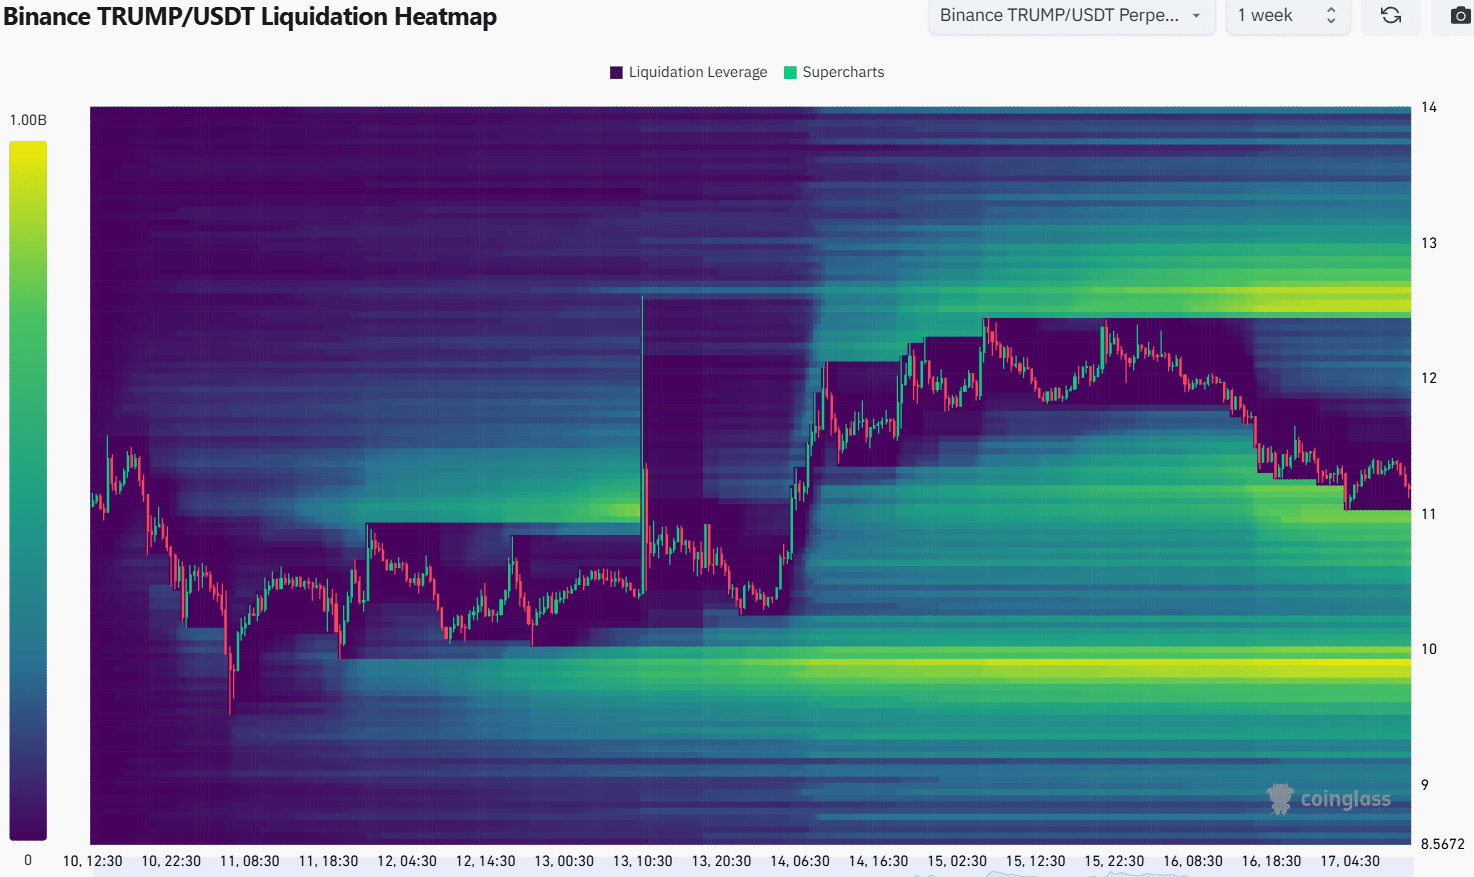
    TRUMP Liquidation HeatmapTRUMP Liquidation Heatmap

    Source: Coinglass

    The liquidity pockets to the south appeared to have strength. The $10.9-$11 and $9.8-$9.9 areas in particular were strongly shaded on the heatmap.

    This reflected a higher concentration of liquidation levels that could attract prices to them.

    These were the short-term price targets. To the north, the $12.5-$12.7 region could also pull prices to it, but this was unlikely to occur in the short term.

    Traders can wait for a move to $10.9 and $9.9 before evaluating whether a bullish reversal is likely.

    Disclaimer: The information presented does not constitute financial, investment, trading, or other types of advice and is solely the writer’s opinion

    Next: Cardano whales sell 100M ADA, but retail holders accumulate – Why?

    Follow on Google News Follow on Flipboard
    Share. Facebook Twitter Pinterest LinkedIn Tumblr Email Copy Link
    Previous ArticlePresident Trump’s World Liberty Financial Purchases More Crypto As Total Losses Hits $118,000,000: On-Chain Data
    Next Article Circle to Bring Hashnote Tokenized Money Market Fund Under Bermuda’s Regulatory Oversight
    Avatar
    Yeek.io
    • Website

    Yeek.io is your trusted source for the latest cryptocurrency news, market updates, and blockchain insights. Stay informed with real-time updates, expert analysis, and comprehensive guides to navigate the dynamic world of crypto.

    Related Posts

    Dogecoin faces a sell wall – Will smart money hold or fold at $0.17?

    June 7, 2025

    Analyzing Dogecoin’s price recovery odds in the wake of Trump-Musk spat

    June 7, 2025

    Examining PENGU’s 9% pump – Will spot sell pressure ruin the bullish setup?

    June 7, 2025
    Leave A Reply Cancel Reply

    Advertisement
    Demo
    Latest Posts

    Whales lose SYRUP sweet tooth despite Maple Finance’s growth

    Ethereum Prepares For A Parabolic Move – ETH/BTC Chart Signals Strong Bullish Setup

    Ethereum Enters Strategic Pause: Will Accumulation Below Resistance Spark A Surge?

    Solana indicators point north, bulls test $165 target

    Popular Posts
    Advertisement
    Demo
    X (Twitter) TikTok Instagram

    Categories

    • Altcoin
    • Bitcoin
    • Blockchain
    • Crypto News

    Categories

    • Defi
    • Ethereum
    • Meme Coins
    • Nfts

    Quick Links

    • Home
    • About
    • Contact
    • Privacy Policy

    Important Links

    • Crypto Chart
    • Crypto Price Chart
    © 2025 Yeek. All Copyright Reserved

    Type above and press Enter to search. Press Esc to cancel.