
Reason to trust
Strict editorial policy that focuses on accuracy, relevance, and impartiality
Created by industry experts and meticulously reviewed
The highest standards in reporting and publishing
Strict editorial policy that focuses on accuracy, relevance, and impartiality
Morbi pretium leo et nisl aliquam mollis. Quisque arcu lorem, ultricies quis pellentesque nec, ullamcorper eu odio.
Ethereum’s price action appears to be setting the stage for a major move that could redefine its market trajectory by the end of 2025. Although recent months have seen the cryptocurrency’s price lose its footing, technical analysis shows that this phase might be coming to an end. Particularly, Ethereum is now trading close to a support level that could cause an upward bounce towards $4,000 by the end of 2025.
Strong Demand Zone Shows Ethereum Bottoming Out
Ethereum’s price action throughout 2025 has been bearish, marked by a series of structural breakdowns that have erased much of the bullish momentum carried over from Q4 2024. Since December 2024, the cryptocurrency has slipped through a series of key technical support levels, beginning with the breakdown of a fair value gap (FVG) near $3,700 in early January.
Related Reading
This was followed by a critical CHoCH (Change of Character) around $3,100 in February, signaling a definitive shift from bullish to bearish sentiment. The situation worsened in March, with Ethereum losing its $2,000 structural support level in the first week of the month, and then plummeting past a major liquidity pool at $1,700 by late March that triggered a further crash until it bottomed at $1,415 on April 9.
According to a TradingView analysis, all these movements have pushed the Ethereum price to its lowest support level, which could lead to a bounce. This support level is around $1,629 on the 3-day candlestick timeframe chart.
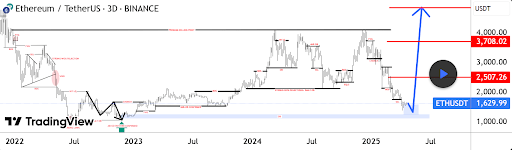
Looking at the 3-day ETH/USDT chart, Ethereum has retraced into this high-demand zone marked by multiple liquidity sweeps and previous order block confirmations back in 2023. This area triggered a significant bullish reversal in 2023, which eventually led to a surge over the ensuing year.
Three Major Targets On The Path To $4,500
Now that Ethereum has bounced around this order block, the next outlook is a bounce above $2,000 and beyond, with the TradingView analyst particularly predicting a surge to $4,500. According to the TradingView analysis, there are three key price levels Ethereum is expected to hit on its way toward a new all-time high around $4,500.
Related Reading
The first target sits around $2,507, a level that corresponds with a bearish order block that led to the break of structure on March 2. The second level, at $3,708, marks a more prominent resistance and is sitting around the fair value gap that arose in January. Finally, the ultimate target lies just beyond $4,500.
At the time of writing, Ethereum is trading at $1,795, up by 10.7% in the past 24 hours and piggybacking off Bitcoin’s break above $90,000.

Featured image from Pixabay, chart from Tradingview.com