Close Menu
    What's Hot

    Whales lose SYRUP sweet tooth despite Maple Finance’s growth

    Ethereum Prepares For A Parabolic Move – ETH/BTC Chart Signals Strong Bullish Setup

    Ethereum Enters Strategic Pause: Will Accumulation Below Resistance Spark A Surge?

    Facebook X (Twitter) Instagram
    yeek.io
    • Crypto Chart
    • Crypto Price Chart
    X (Twitter) Instagram TikTok
    Trending Topics:
    • Altcoin
    • Bitcoin
    • Blockchain
    • Crypto News
    • DeFi
    • Ethereum
    • Meme Coins
    • NFTs
    • Web 3
    yeek.io
    • Altcoin
    • Bitcoin
    • Blockchain
    • Crypto News
    • DeFi
    • Ethereum
    • Meme Coins
    • NFTs
    • Web 3
    Meme Coins

    WIF traders should expect a 9% price rally, but THESE are the risks ahead!

    Yeek.ioBy Yeek.ioMay 23, 2025No Comments2 Mins Read
    Share Facebook Twitter Pinterest Copy Link Telegram LinkedIn Tumblr Email
    Share
    Facebook Twitter LinkedIn Pinterest Email
    • WIF saw its bullish momentum stalled at the $1.18-$1.2 resistance
    • Liquidity around $1.2-$1.25 could drag WIF higher within a day or two

    dogwifhat [WIF] has rallied to the highs of its 10-day-old range formation. At a time when Bitcoin [BTC] was hitting new ATHs, the altcoin market has only kept pace with the king of crypto. In fact, many tokens have posted double-digit percentage gains over the past week. However, it’s worth noting that the major memecoins are not running wild yet.

    With this in mind, WIF’s challenge of the range highs might not see immediate success. The crypto market participants seem to be focused on Bitcoin, and the move past $1.2 might take more time.

    dogwifhat bulls assail the $1.18 resistance once again

    WIF 1-day Chart

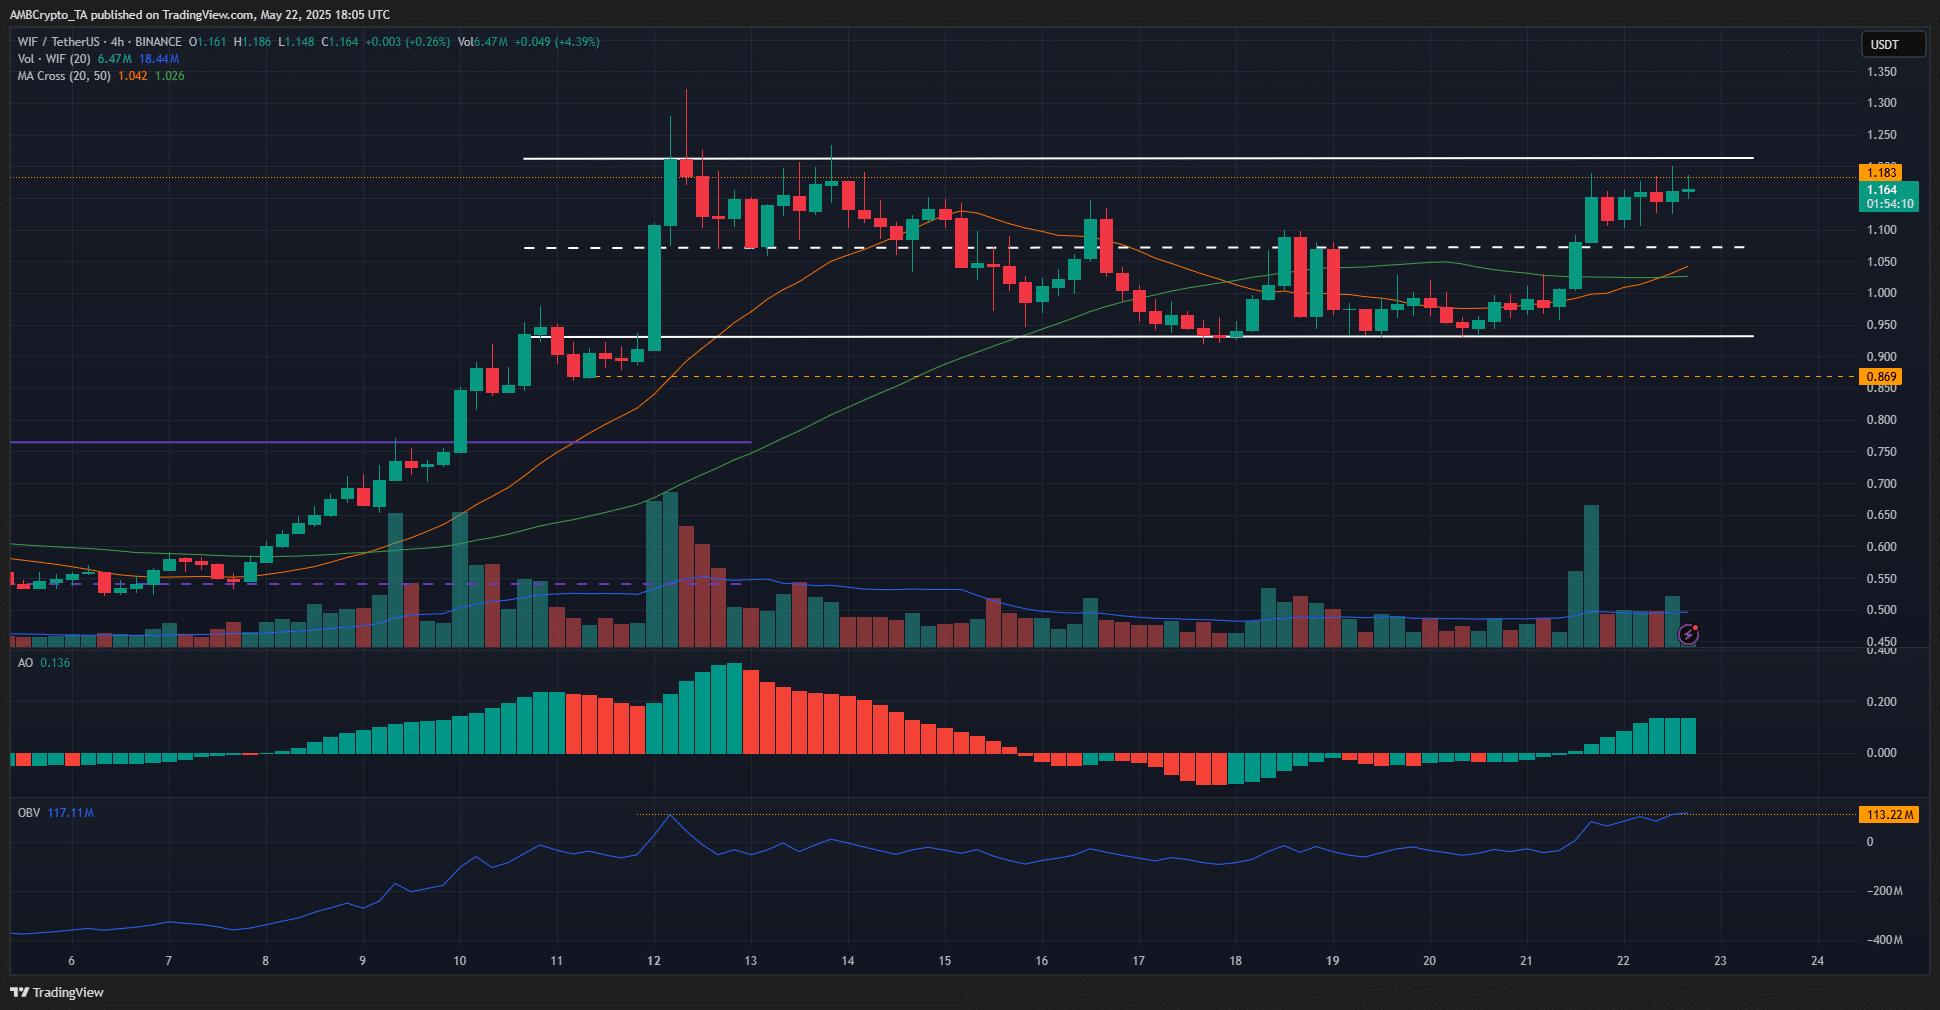
    Source: WIF/USDT on TradingView

    The short-term range formation (white) extended from $0.93 to $1.21, with the mid-range level at $1.07. At press time, the price had stalled just under the range highs for a couple of days.

    This resistance level at $1.18 marked the lower high set in late January, when WIF was on a strong downtrend. Therefore, the level seemed to be an important long-term horizontal level. Combined with the range formation, it seemed likely that a move past $1.18-$1.21 and a retest as support would offer a good buying opportunity.

    That buying opportunity is not here yet though. The OBV has trended higher over the past ten days, but seemed unable to breach the high from ten days ago. While the trading volume did climb slightly over the last 24 hours, it did not forecast a breakout at press time.
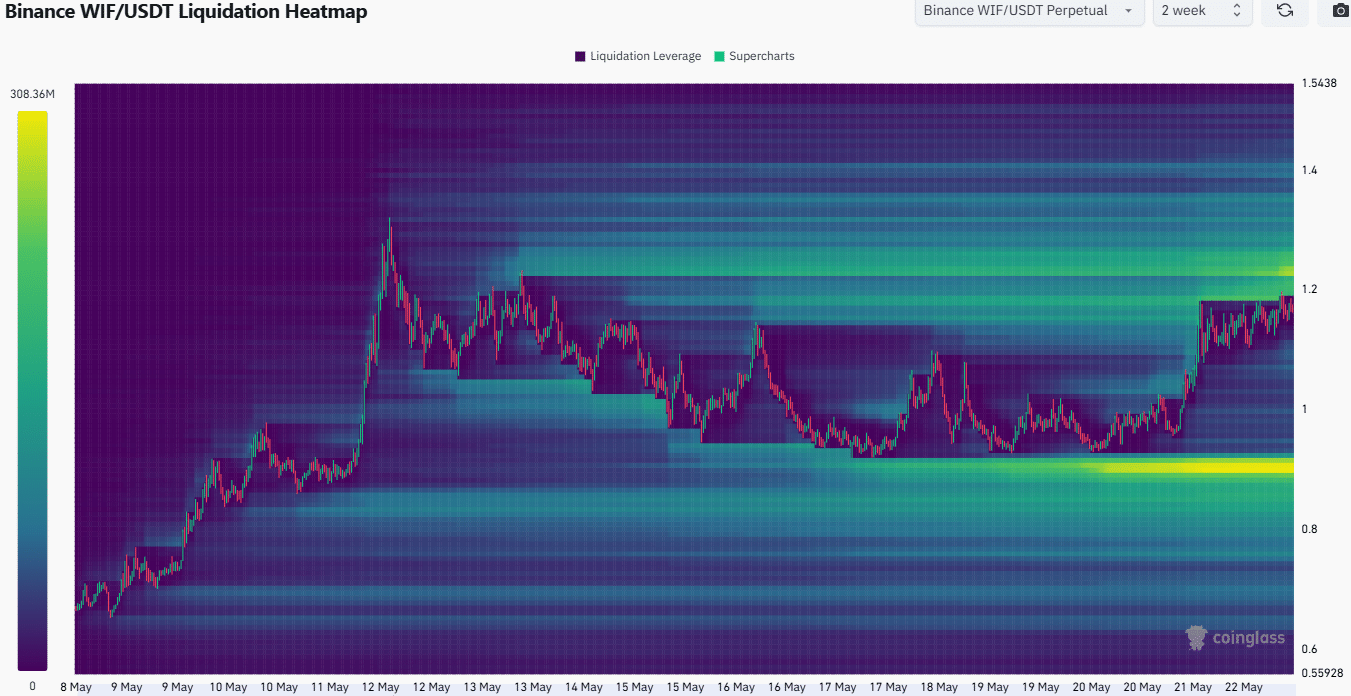
    WIF Liquidation HeatmapWIF Liquidation Heatmap

    Source: Coinglass

    The liquidation heatmap revealed that WIF may be likely to brush the range highs soon. There seemed to be a buildup of liquidity around the $1.2-$1.26 area. Since liquidity attracts price, and the magnetic zone was close to the market price, it may be highly probable that WIF would be pulled towards $1.26.

    If the memecoin does break out past $1.26, a retest of the former resistance as support could be the beginning of the next rally.

    Disclaimer: The information presented does not constitute financial, investment, trading, or other types of advice and is solely the writer’s opinion

    Next: BONK eyes 77% breakout as price holds key support at 200 EMA

    Follow on Google News Follow on Flipboard
    Share. Facebook Twitter Pinterest LinkedIn Tumblr Email Copy Link
    Previous ArticleTRUMP token volatility spikes as Trump hosts private dinner
    Next Article Jupiter announces Jupiter Lend launch for summer as JUP price surges 14%
    Avatar
    Yeek.io
    • Website

    Yeek.io is your trusted source for the latest cryptocurrency news, market updates, and blockchain insights. Stay informed with real-time updates, expert analysis, and comprehensive guides to navigate the dynamic world of crypto.

    Related Posts

    Dogecoin faces a sell wall – Will smart money hold or fold at $0.17?

    June 7, 2025

    Analyzing Dogecoin’s price recovery odds in the wake of Trump-Musk spat

    June 7, 2025

    Examining PENGU’s 9% pump – Will spot sell pressure ruin the bullish setup?

    June 7, 2025
    Leave A Reply Cancel Reply

    Advertisement
    Demo
    Latest Posts

    Whales lose SYRUP sweet tooth despite Maple Finance’s growth

    Ethereum Prepares For A Parabolic Move – ETH/BTC Chart Signals Strong Bullish Setup

    Ethereum Enters Strategic Pause: Will Accumulation Below Resistance Spark A Surge?

    Solana indicators point north, bulls test $165 target

    Popular Posts
    Advertisement
    Demo
    X (Twitter) TikTok Instagram

    Categories

    • Altcoin
    • Bitcoin
    • Blockchain
    • Crypto News

    Categories

    • Defi
    • Ethereum
    • Meme Coins
    • Nfts

    Quick Links

    • Home
    • About
    • Contact
    • Privacy Policy

    Important Links

    • Crypto Chart
    • Crypto Price Chart
    © 2025 Yeek. All Copyright Reserved

    Type above and press Enter to search. Press Esc to cancel.