Close Menu
    What's Hot

    ‘Market knows something’: Meteora’s odds climb to 28% on Polymarket

    21Shares brings new SUI Spot ETF to Nasdaq: ‘The moment is finally here!’

    Dogecoin – Why history suggests holders can expect 2 more years of pain

    Facebook X (Twitter) Instagram
    yeek.io
    • Crypto Chart
    • Crypto Price Chart
    X (Twitter) Instagram TikTok
    Trending Topics:
    • Altcoin
    • Bitcoin
    • Blockchain
    • Crypto News
    • DeFi
    • Ethereum
    • Meme Coins
    • NFTs
    • Web 3
    yeek.io
    • Altcoin
    • Bitcoin
    • Blockchain
    • Crypto News
    • DeFi
    • Ethereum
    • Meme Coins
    • NFTs
    • Web 3
    Altcoin

    How MOVE’s recovery prospects may be at risk thanks to selling pressure

    Yeek.ioBy Yeek.ioJanuary 13, 2025No Comments3 Mins Read
    Share Facebook Twitter Pinterest Copy Link Telegram LinkedIn Tumblr Email
    Share
    Facebook Twitter LinkedIn Pinterest Email
    • Movement token has a bearish technical bias in the short-term, faces sell-pressure at $1
    • On-chain metrics suggested bulls can be hopeful of a recovery

    Movement [MOVE] saw a 5% hike in Open Interest in the 24 hours before press time. This was accompanied by a 3.3% price gain. During this time, Bitcoin [BTC] gained by 0.04%, with its OI dropping by 0.09% too.

    Despite the bearishness of Bitcoin, however, the realized cap and supply distribution metrics revealed that MOVE might be gearing up for a recovery.

    MOVE range formation outlines crucial support and resistance levels

    MOVE 4-hour Chart

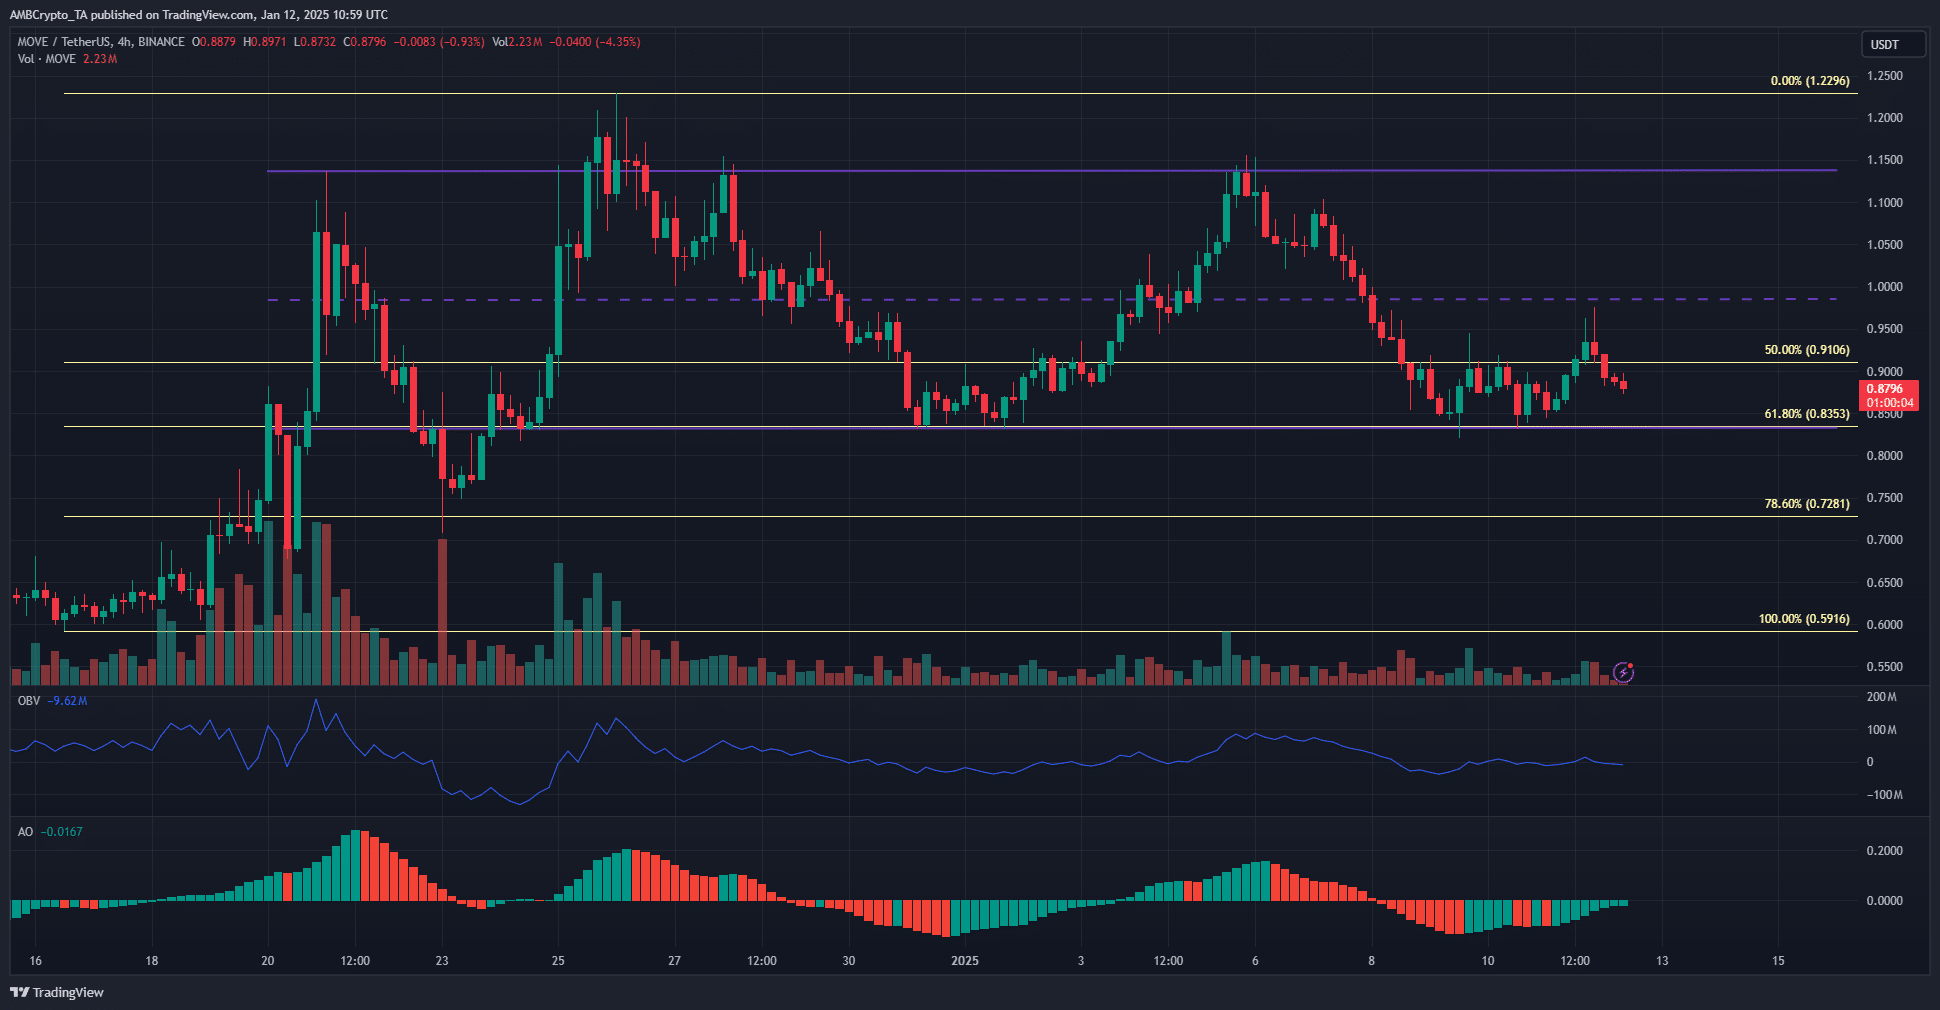
    Source: MOVE/USDT on TradingView

    Over the past month, Movement token has traded within a range. It climbed from $0.83 to $1.13, with the mid-range level at $0.98. Over the last five days, the mid-range level has opposed bullish efforts at recovery. It also lined up with the psychological $1-level, making it a harder challenge for the buyers to overcome.

    The $0.8-$0.83 area is a support zone. The OBV has not formed new lows over the past two weeks – An encouraging sight. The selling volume was not overwhelming either. The Awesome Oscillator showed bearish momentum was the norm in recent days, but it seemed to be on the verge of forming a bullish crossover too.
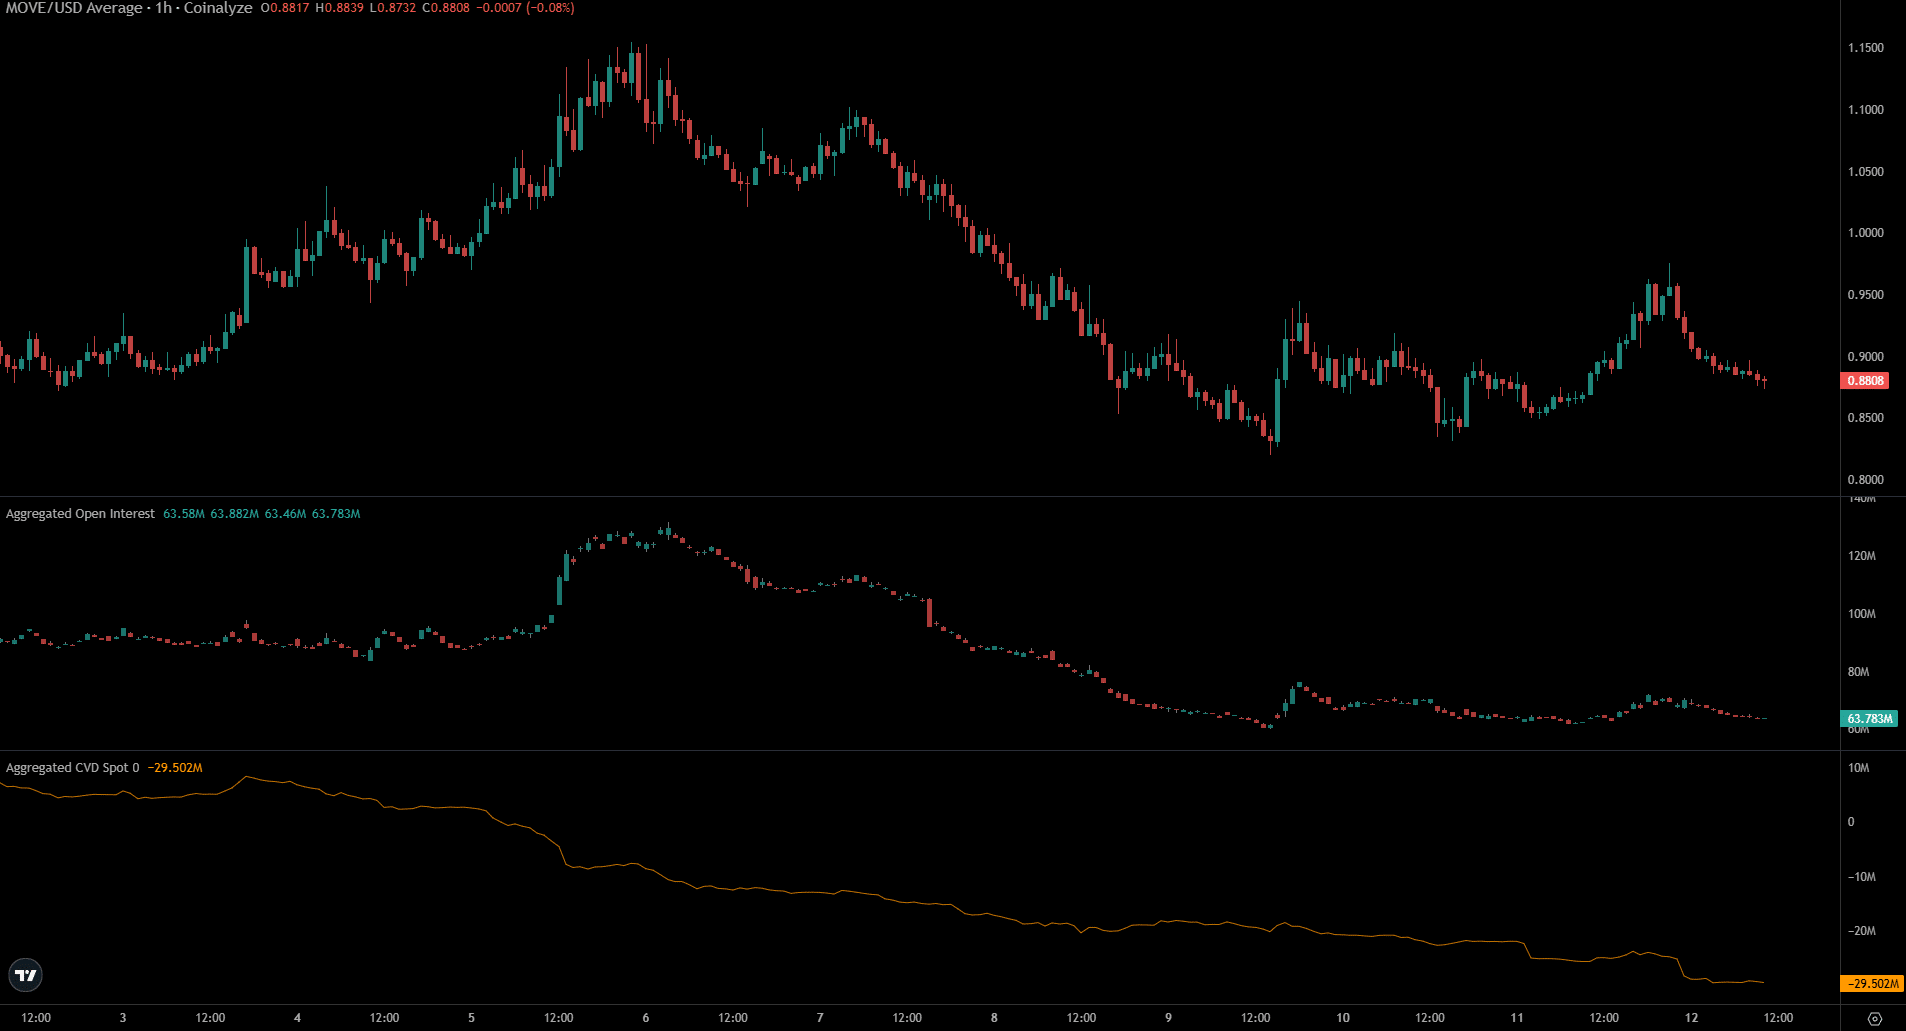
    Movement CoinalyzeMovement Coinalyze

    Source: Coinalyze

    Meanwhile, data from Coinalyze highlighted strong short-term bearish sentiment.

    The Open Interest has been trending lower alongside the spot CVD. The 5% gains over the last 24 hours were too little to counteract the prevalent selling sentiment.

    Short-term realized cap underlines distribution trends
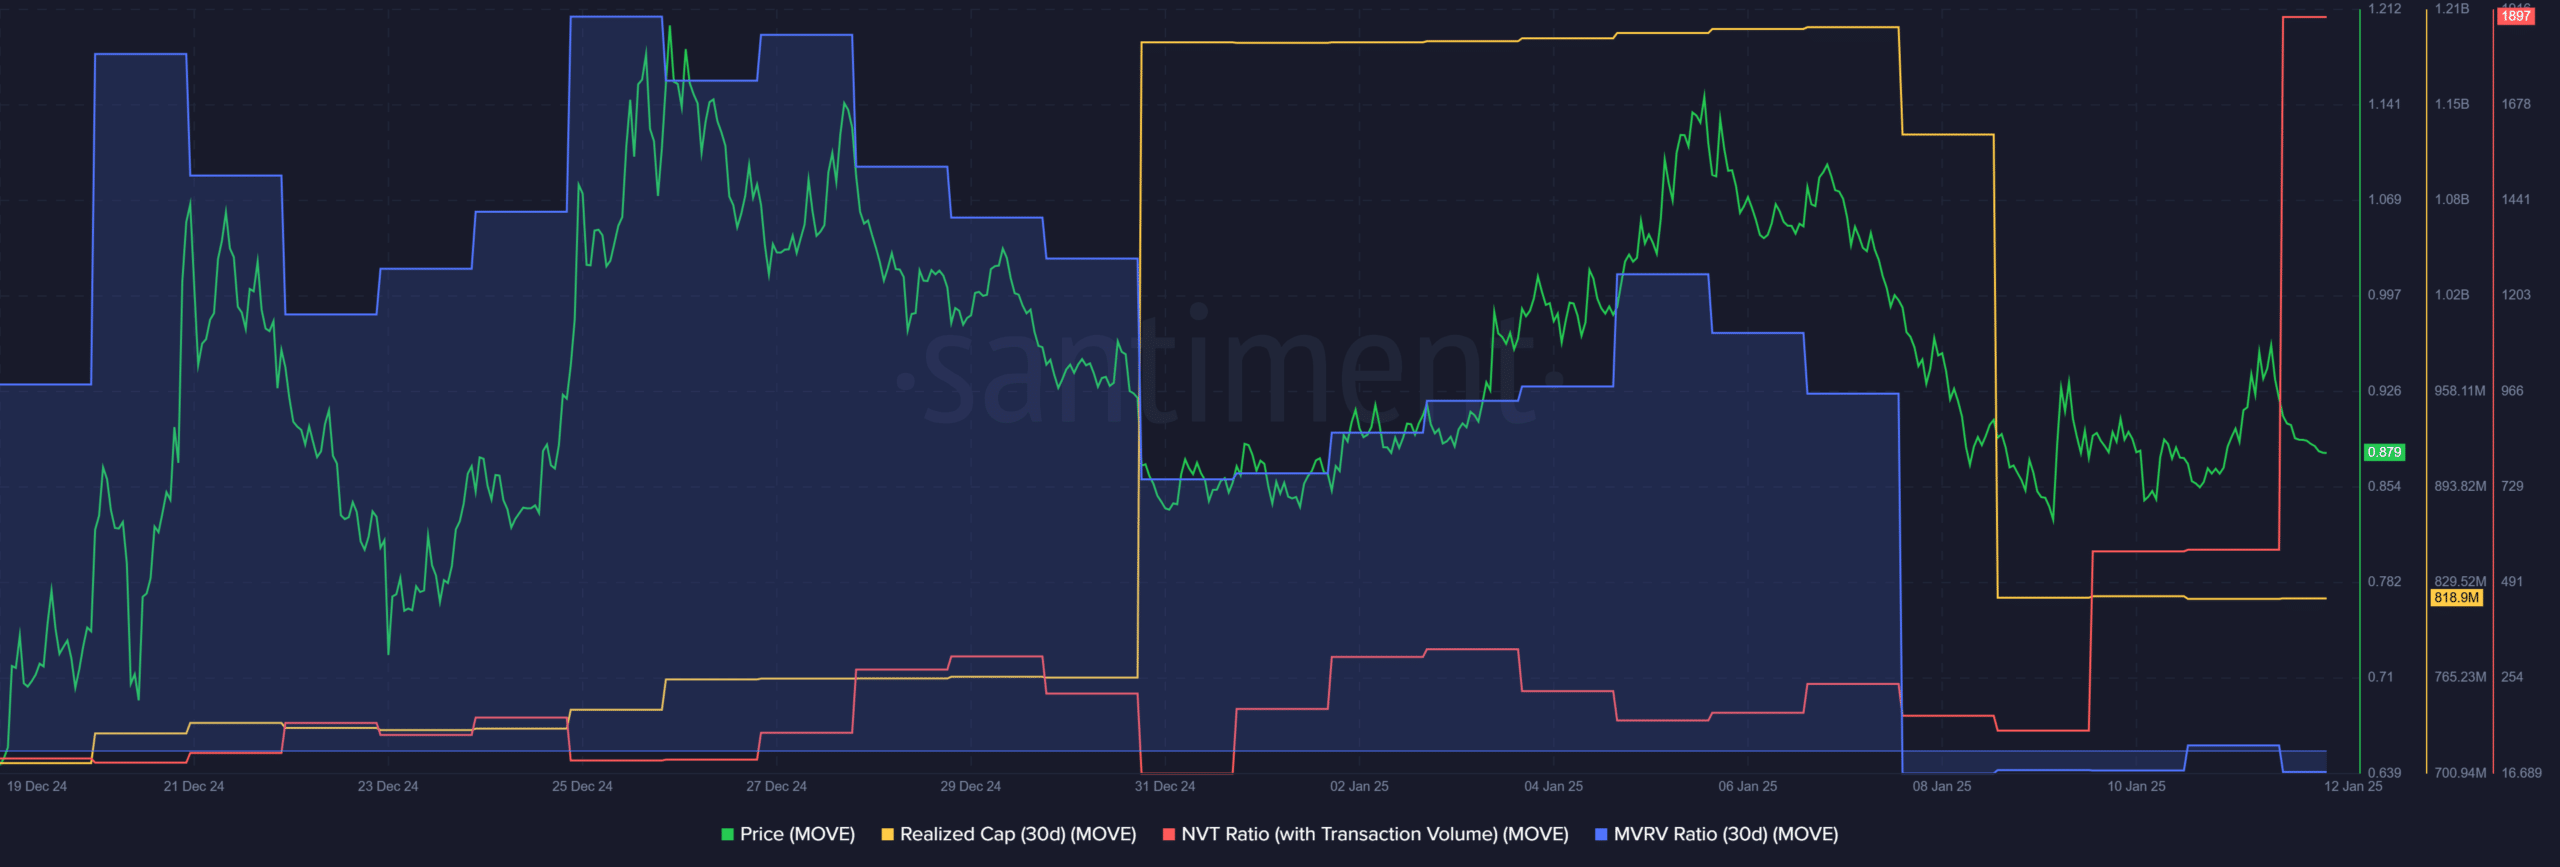
    Movement Santiment MetricsMovement Santiment Metrics

    Source: Santiment

    The NVT ratio saw a sharp uptick recently. This indicated potential overvaluation of the token, relative to its transaction volume. The 30-day MVRV ratio was at -4%, highlighting that MOVE holders were at a minor loss.

    The realized cap across the 30-day window saw a steep fall last week, alongside its dwindling price. Since the realized cap calculates the value of an asset based on the price at which each token was last moved, this meant participants were moving the token at lower prices.
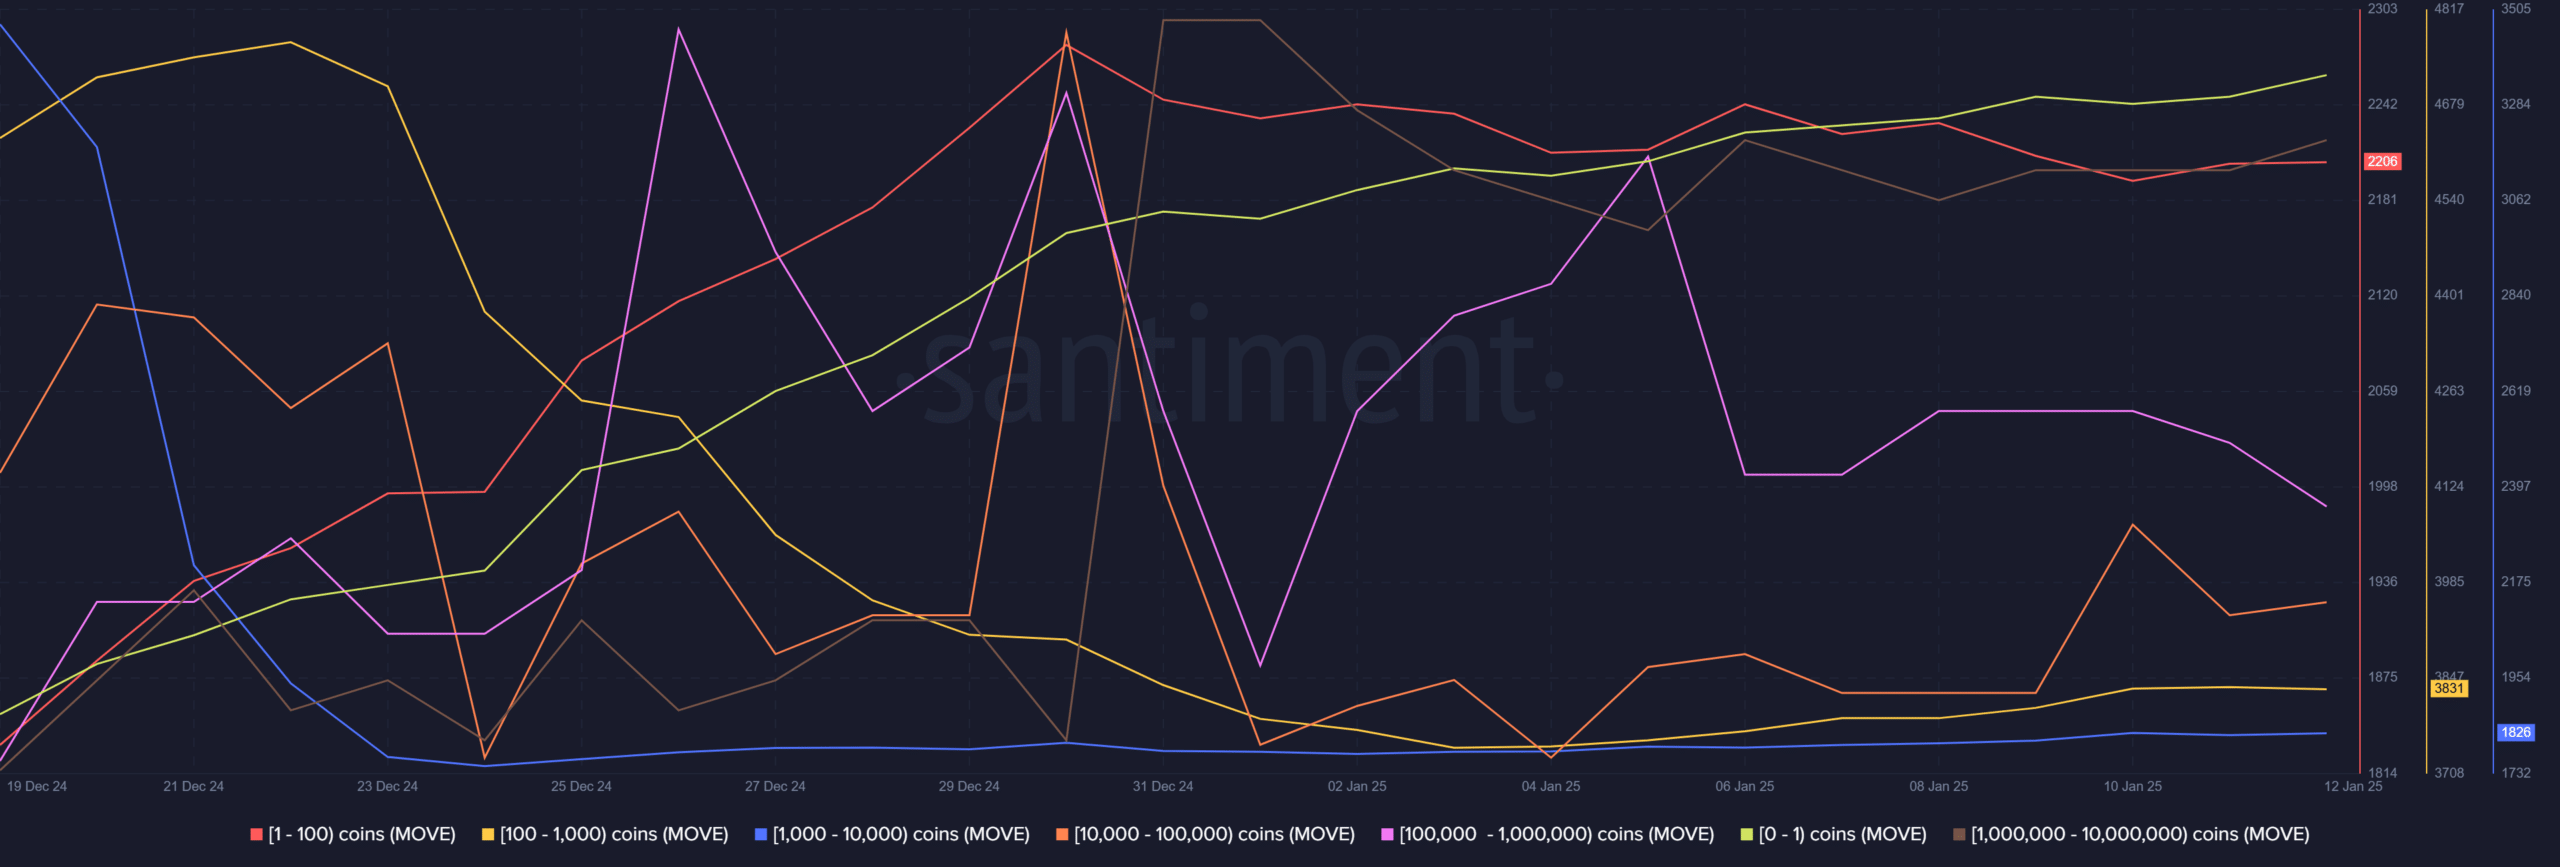
    Movement Supply DistributionMovement Supply Distribution

    Source: Santiment

    Finally, supply distribution analysis showed that apart from the wallets holding 100k-1 million MOVE, most other market participants were buying more. This whale cohort is arguably among the most important holders. Despite the downtick over the past week, their numbers were still higher than it was before Christmas.


    Read Movement’s [MOVE] Price Prediction 2025-26


    Overall, the short-term bias was bearish, and the OI change was not enough for MOVE’s recovery. Thus, traders can keep an eye on the realized cap metric.

    A sudden spike would be a buy signal. Meanwhile, steady accumulation from some cohorts of holders also implied conviction.

    Next: Bitcoin – Is a ‘local bottom’ in? THIS metric says so, but…

    Follow on Google News Follow on Flipboard
    Share. Facebook Twitter Pinterest LinkedIn Tumblr Email Copy Link
    Previous Article5 Altcoins to Buy Now as Bitcoin Hovers at $95K After DOJ Dip
    Next Article What is Bitcoin ETF and How Does it Work?
    Avatar
    Yeek.io
    • Website

    Yeek.io is your trusted source for the latest cryptocurrency news, market updates, and blockchain insights. Stay informed with real-time updates, expert analysis, and comprehensive guides to navigate the dynamic world of crypto.

    Related Posts

    Why is crypto up today—FOMC news, ETF flows and…

    March 20, 2025

    Binance Coin (BNB) Price Prediction for March 20

    March 20, 2025

    Trump becomes first US sitting president to speak at a crypto conference

    March 20, 2025
    Leave A Reply Cancel Reply

    Advertisement
    Demo
    Latest Posts

    ‘Market knows something’: Meteora’s odds climb to 28% on Polymarket

    21Shares brings new SUI Spot ETF to Nasdaq: ‘The moment is finally here!’

    Dogecoin – Why history suggests holders can expect 2 more years of pain

    PIPPIN price prediction: How AI-memecoin outpaced Bitcoin to post 22% rally

    Popular Posts
    Advertisement
    Demo
    X (Twitter) TikTok Instagram

    Categories

    • Altcoin
    • Bitcoin
    • Blockchain
    • Crypto News

    Categories

    • Defi
    • Ethereum
    • Meme Coins
    • Nfts

    Quick Links

    • Home
    • About
    • Contact
    • Privacy Policy

    Important Links

    • Crypto Chart
    • Crypto Price Chart
    © 2026 Yeek. All Copyright Reserved

    Type above and press Enter to search. Press Esc to cancel.