
After testing the low $90,000 price level multiple times over the past two months, Bitcoin (BTC) briefly broke out of its tight trading range earlier this week, reaching a new all-time high (ATH) of $108,786. However, a recent report by Glassnode suggests that the sustained consolidation observed in recent months may be nearing its end, with the leading cryptocurrency primed for its next significant move.
Bitcoin Profit-Taking Declines Sharply
According to the latest edition of Glassnode’s ‘The Week On-Chain Report,’ BTC profit-taking volumes have dropped significantly, falling from a peak of $4.5 billion in December to approximately $316.7 million – a sharp decline of 93%.
This drop in profit-taking signals a substantial reduction in sell-side pressure for Bitcoin. Currently, BTC is trading within a tight 60-day price range, a pattern that has often preceded significant market volatility.
Related Reading
When Bitcoin trades in a narrow price range, it either signals the beginning of a bull market rally or the final stages of a bear market capitulation. One key metric highlighted in the report is the Realized Supply Density, which measures Bitcoin’s supply concentration around the current spot price within a 15% range, both up and down.
Currently, approximately 20% of Bitcoin’s supply is within this price band, indicating heightened price sensitivity. Small price movements within this range could significantly impact investor profitability, thereby fueling market volatility.
The report also points to a key metric, CoinDay Destruction (CDD), as further evidence of declining sell-side pressure. During late December and early January, CDD values were notably high, reflecting increased activity by long-term holders. However, the metric has cooled off in recent weeks.
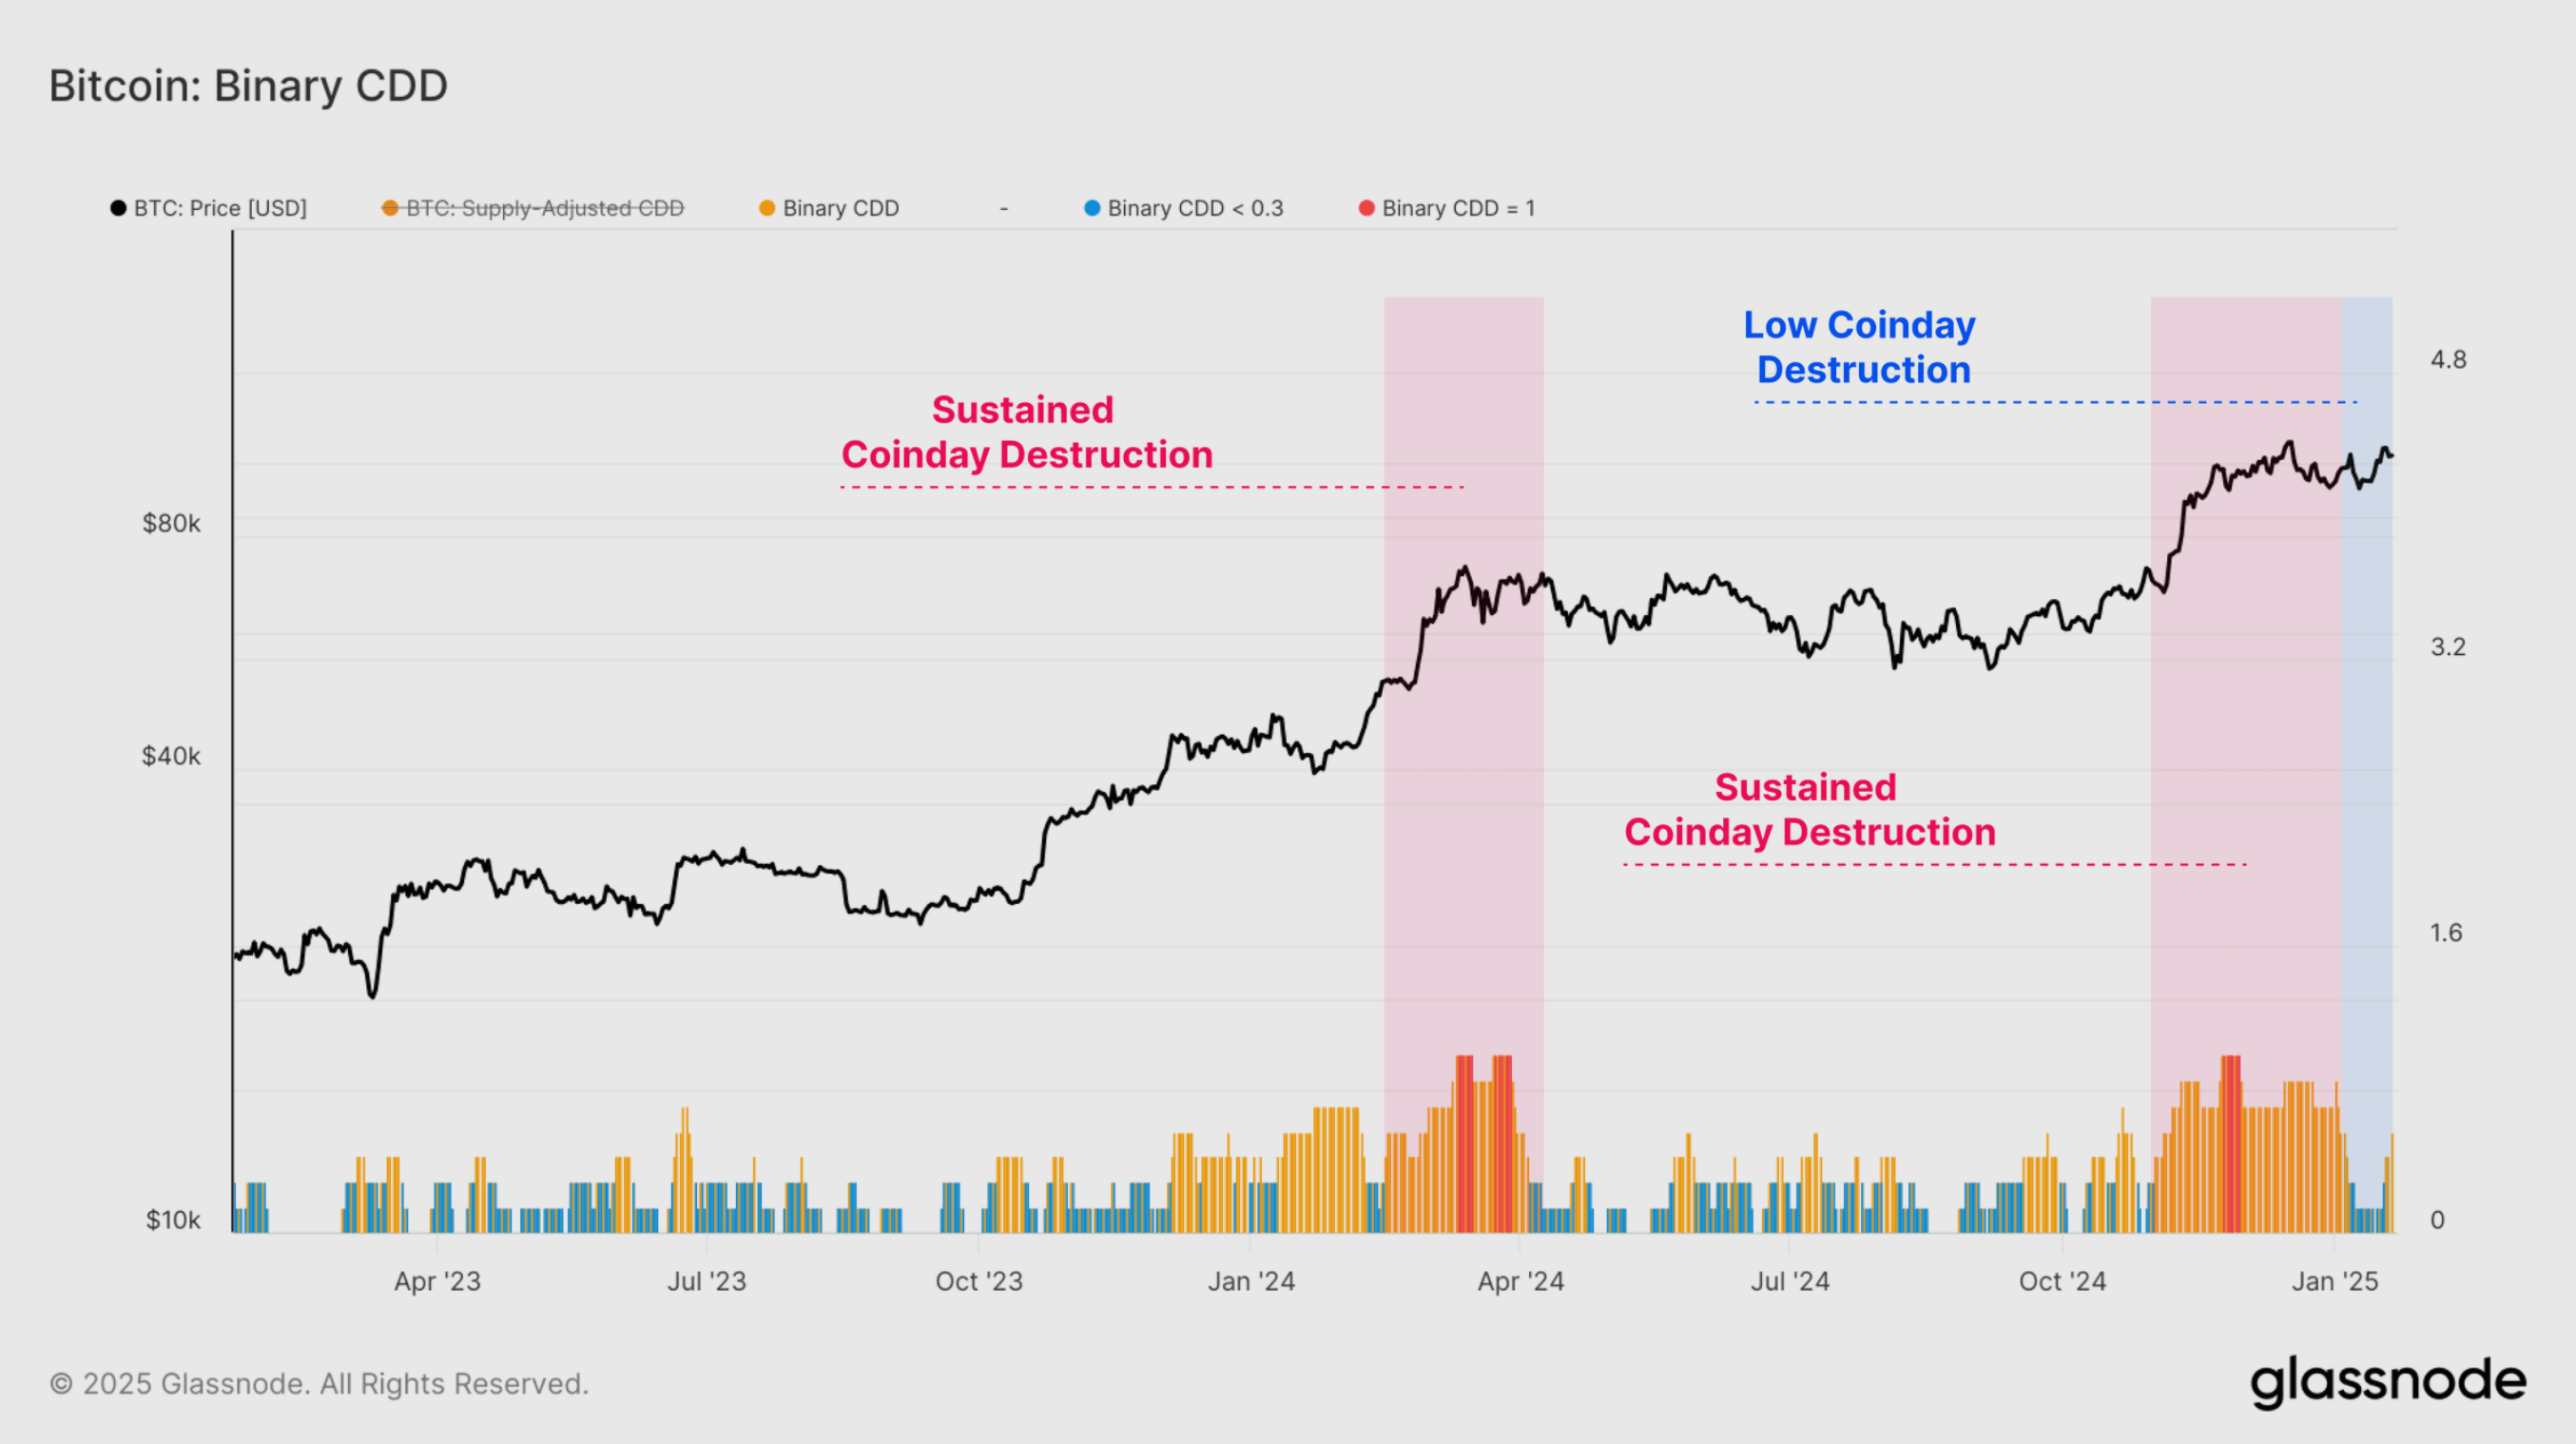
For the uninitiated, CDD measures the economic activity of spent BTC by tracking how long coins were held before being moved. It multiplies the number of coins by the number of days they remained idle, highlighting whether long-term holders are spending their coins.
The recent decline in CDD suggests that many BTC investors who planned to take profits have already done so within the current price range. As a result, the market may enter a new price range to unlock the next wave of supply and liquidity.
Long-Term Investors Return To Accumulation Mode
The report also highlights the Long-Term Holder (LTH) Binary Spending Indicator, a key metric that tracks Bitcoin held by long-term investors. The report notes:
Aligned with the heavy profit-taking volumes from before, we can see a significant decline in the total LTH Supply as the market reached $100k in December. The rate of LTH Supply decline has since stalled out, suggesting a softening of this distribution pressure in recent weeks.
Additionally, LTH inflows to crypto exchanges have fallen sharply, dropping from $526.9 million in December to just $92.3 million. That said, the total LTH BTC supply is showing signs of growth, indicating that long-term investors are returning to accumulation mode.
Related Reading
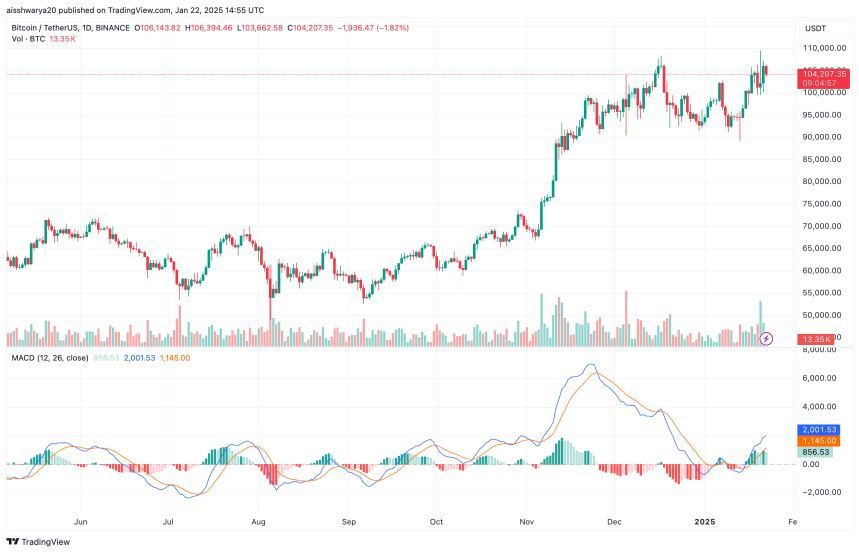
Meanwhile, retail demand for BTC remains strong. Investors holding less than 10 BTC collectively purchased approximately 25,600 BTC in the past month. In comparison, Bitcoin miners minted only 13,600 BTC during the same period. At press time, BTC trades at $104,207, up 0.5% in the past 24 hours.
Featured image from Unsplash, Charts from Glassnode and TradingView.com