
According to Glassnode’s latest The Week On-Chain report, Bitcoin (BTC) must remain above the Short-Term Holder (STH) cost basis to avoid potential downside risks. Historically, this price level has served as a crucial pivot point between local bull and bear market phases, making it a key area to watch.
Bitcoin Must Avoid Sliding Below STH Cost Basis
Since the beginning of February, BTC has been trading within a narrow range between $93,000 and $98,000. The leading cryptocurrency by market cap has managed to withstand the impact of several major macroeconomic events, including US President Donald Trump’s proposed trade tariffs.
However, BTC’s resilience does not guarantee immunity from shifting market sentiment. Glassnode’s report emphasizes that for Bitcoin to sustain its bullish momentum, it must remain above the STH cost basis, which currently sits at approximately $92,500.
Per the report, BTC is currently trading $1,000 to $5,000 above the STH cost basis. Past data indicates that the STH cost basis level has usually acted as a pivot point where the average recent buyer moves between a state of unrealized profit or loss.
If BTC falls below $92,500, it would imply that the average short-term holder is at an unrealized loss, potentially triggering panic selling. On the other hand, trading above this level means that most short-term holders are in profit, which could reinforce bullish momentum.
Glassnode’s report includes a chart illustrating this trend. As seen below, whenever BTC reached a new all-time high (ATH), followed by a correction, it tended to touch the lower band of the STH cost basis model.
The chart further shows that historical BTC downtrends have typically extended to about -1 standard deviation below the STH cost basis. Applying this model to the current market cycle, BTC could decline to as low as $71,600, where the model’s lower band is positioned.
Crypto Market Close To ‘Decisive Moment’
The report notes that the crypto market is currently witnessing an accumulation phase which mirrors that of May 2021. Although new investors aggressively accumulated BTC in April 2024, the magnitude of the STH supply uptrend in the current cycle structurally aligns more with May 2021 rather than 2024.
As a result, the market is approaching a decisive moment, characterized by sharp price action in either direction. The report explains:
If demand remains strong, Bitcoin could establish a new range above ATHs. However, a lack of sustained buy pressure could lead to a deeper distribution-driven correction, similar to prior post-ATH phases. This would likely be driven by panic amongst recent buyers who see their recently acquired coins move from being in profit to holding an unrealized loss.
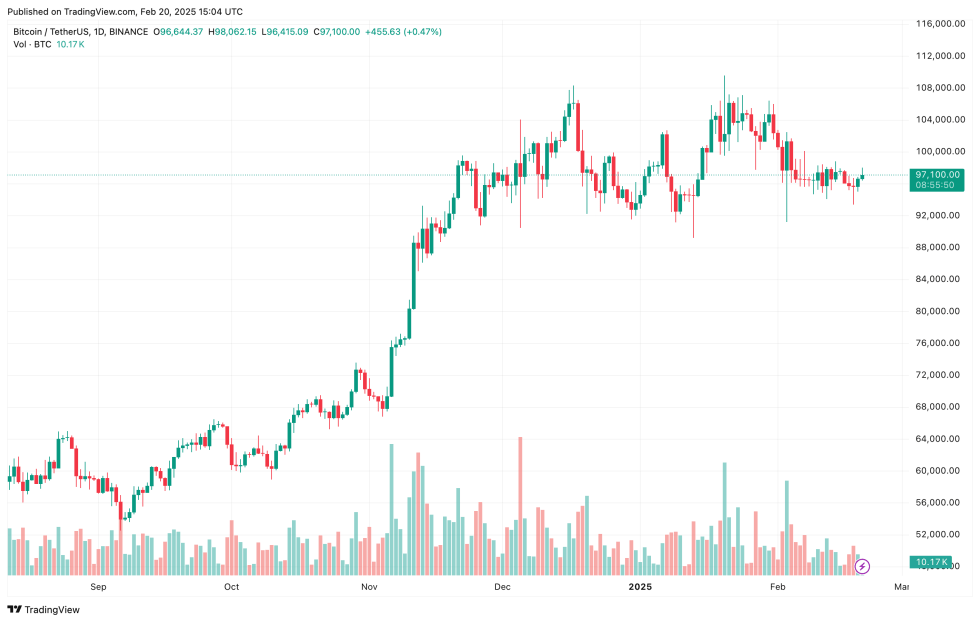
While downside risks remain, BTC bulls can rejoice as the US dollar’s expected decline is likely to benefit the flagship cryptocurrency. Similarly, sentiment around BTC is starting to reignite following the slump in memecoin frenzy. At press time, BTC trades at $97,100, up 1.2% in the past 24 hours.
Featured Image from Unsplash.com, Charts from Glassnode and TradingView.com