Bitcoin (BTC) price has declined by more than 8.5% over the last 24 hours days after rallying to $95,000 on Sunday, March 2.
Data from Cointelegraph Markets Pro and TradingView shows that the price of Bitcoin suddenly dropped from a high of $94,422 on March 3 to an intra-day low of $82,450 on March 4.
BTC/USD daily chart. Source: TradingView
Bitcoin’s price drop coincides with a marketwide drawdown fueled by the implementation of trade tariffs imposed by US President Donald Trump’s administration on imports from Mexico, Canada and China.
Related: Bitcoin no longer ‘safe-haven’ as $82K BTC price dive leaves gold on top
The ensuing sell-off has left market participants wondering how much deeper the drawdown can go.
Bitcoin wipes out liquidity in tumble to $82,000
Data from Cointelegraph Markets Pro and TradingView showed losses mounting during the Asia and Europe trading session.
Key points:
-
BTC price fell as low as $82,450 on Bitstamp, wiping out all the gains made between March 1 and March 2.
-
This came as the US tariffs against China, Mexico and Canada took effect.
-
24-hour crypto market liquidations hit $980 million, per data from monitoring resource CoinGlass.
-
As Bitcoin fell below $90,000, it wiped out more than $350 million in long positions between March 3 and March 4.

Crypto liquidations (screenshot). Source: CoinGlass
-
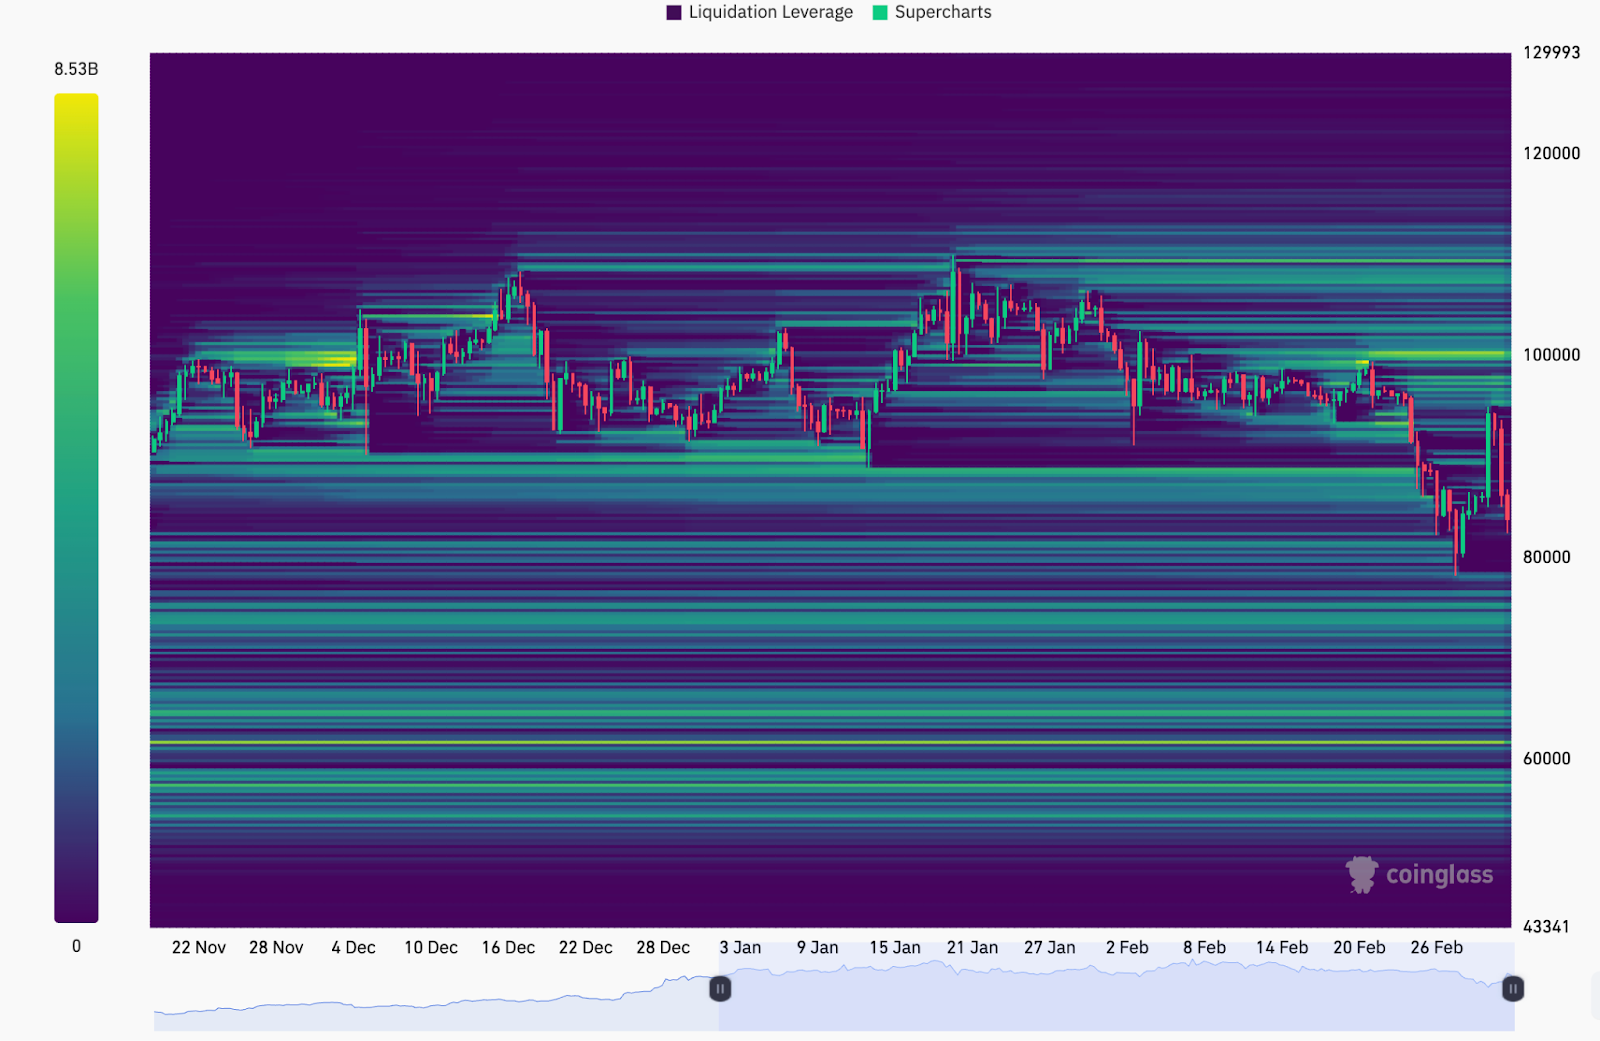
Additional data from CoinGlass showed intensive bands of buyer interest within the $70,000 – $80,000 range.
-
This suggests that Bitcoin’s price might drop further to sweep the liquidity within this range before staging a sustained recovery.

BTC/USDT liquidation heatmap. Source: CoinGlass
Reacting, crypto analyst AlphaBTC noted that “Bitcoin fishing for liquidity” with its latest move, adding that strong selling could push the price to $70,000.
“I’m not seeing any strength at the moment, all of Crypto is taking a beating.”
200-day SMA provides last line of defense for Bitcoin
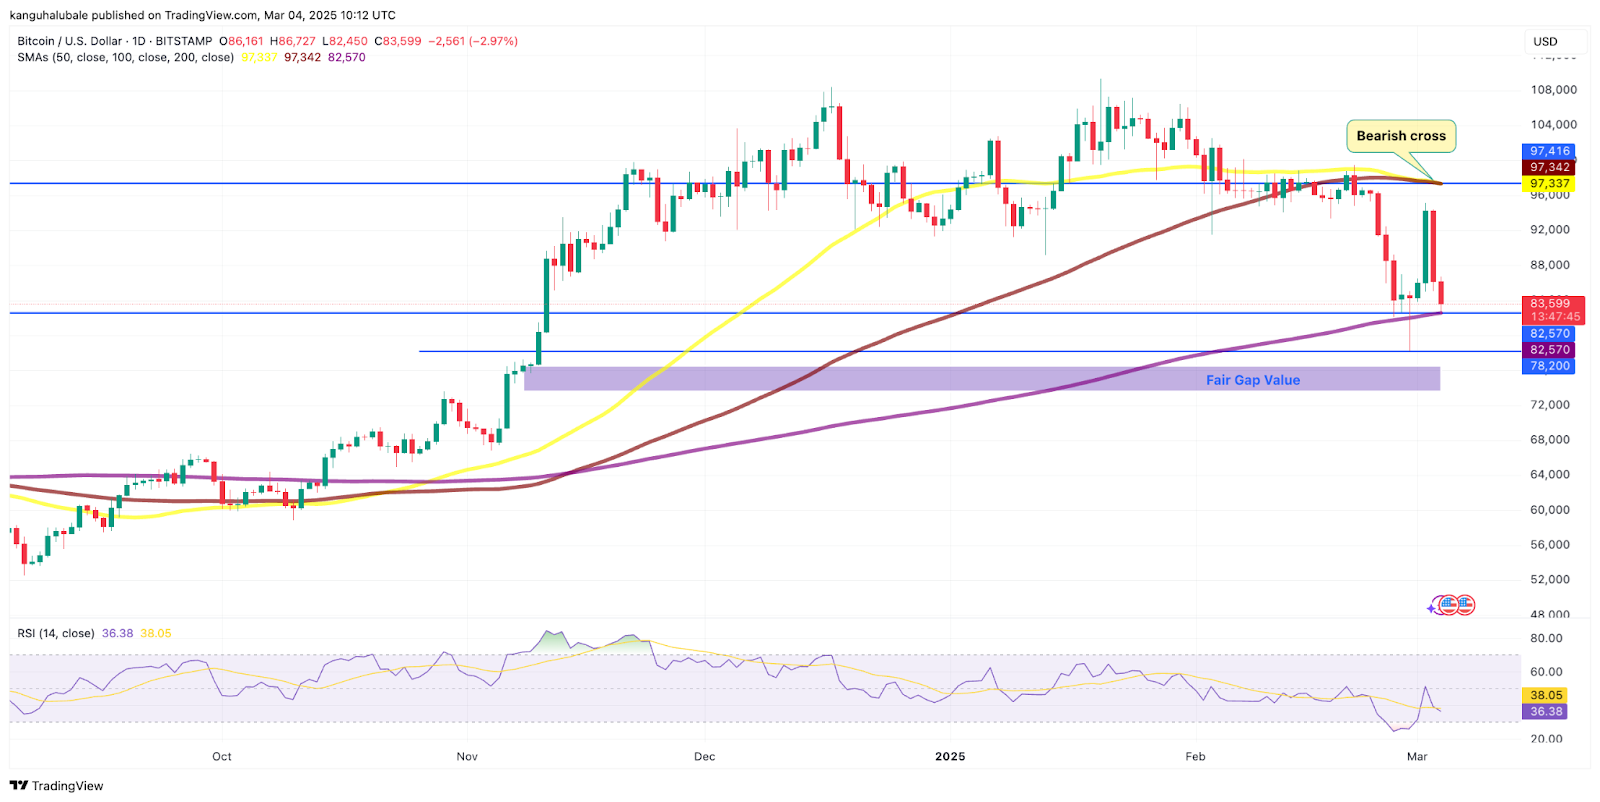
From a technical point of view, Bitcoin’s price is sitting on immediate support above $82,500, or the 200-day simple moving average (SMA).
What to know:
-
A drop below the 200-day SMA will cause the price to drop from the current levels toward lower lows.
-
The first key level to watch is the Feb. 28 low, around $78,200.
-
Another area of interest is the fair gap value between $73,600 and $76,550, created during the November 2024 rally fueled by Trump’s election victory.
-
A bearish cross appeared on the daily chart when the 50-day SMA just crossed below the 100-day SMA, as shown below.
-
This indicates a shift in market sentiment from bullish to bearish, signifying a possible continuation of the downtrend.

BTC/USD daily chart. Source: Cointelegraph/TradingView
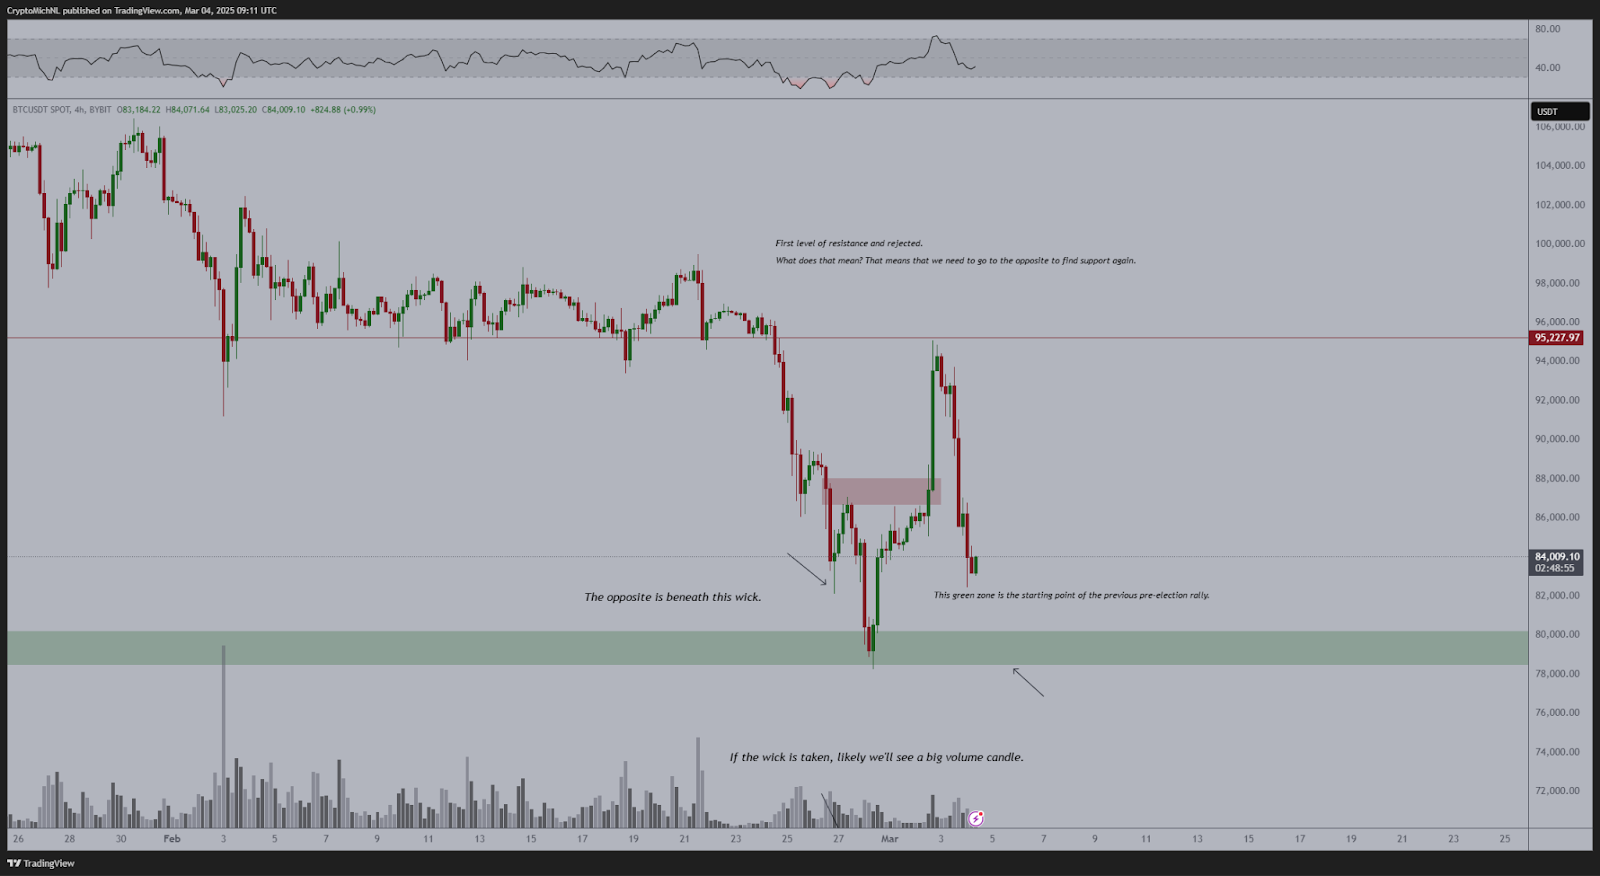
Founder of MN Capital Michael van de Poppe argued that after being rejected by the resistance at $95,000, Bitcoin is back to “chopping around” in the four-hour timeframe.
For van de Poppe, a drop below the Feb. 28 low of $78,200 will result in a large volume candle that drives Bitcoin’s price toward mid-70,000.
“Honestly, I think we’ll need to wait until this week is over as there’s a lot of macro-economic data and events and the Summit.”

BTC/USD 4-hour chart. Source: Michael van de Poppe
This article does not contain investment advice or recommendations. Every investment and trading move involves risk, and readers should conduct their own research when making a decision.

