
- Cardano faced a critical test at $0.80–$0.66, with volatility keeping traders on edge.
- Large transactions were declining, signaling reduced whale interest—Will ADA regain momentum?
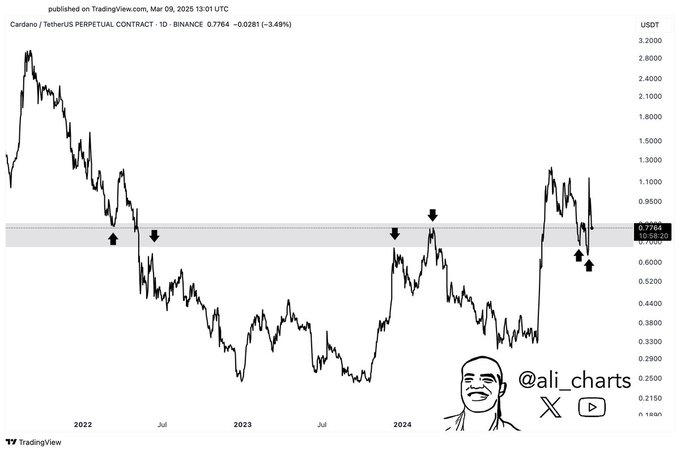
Cardano [ADA] is trading within a crucial support zone between $0.80 and $0.66, a level that has historically played a major role in price movements.
The crypto market continues to show volatility, with ADA recording a 2.65% decline in the past 24 hours and a 20.20% drop over the past week.
ADA’s key support and resistance levels
ADA’s price has returned to the $0.80–$0.66 support range, a level that has previously served as both resistance and support during past market cycles.
According to crypto analyst Ali Martinez, maintaining this level could be crucial in determining ADA’s next move.
Historical trends reveal that in mid-2022, Cardano failed to hold this range and experienced a substantial decline. In 2023, it faced rejection at this level before finally breaking above it in early 2024.
Now, the price has once again returned to test this critical support range.
Source: X
A successful hold could spark a recovery, but a drop below $0.66 may open the door to lower price levels.
Technical indicators signal uncertainty
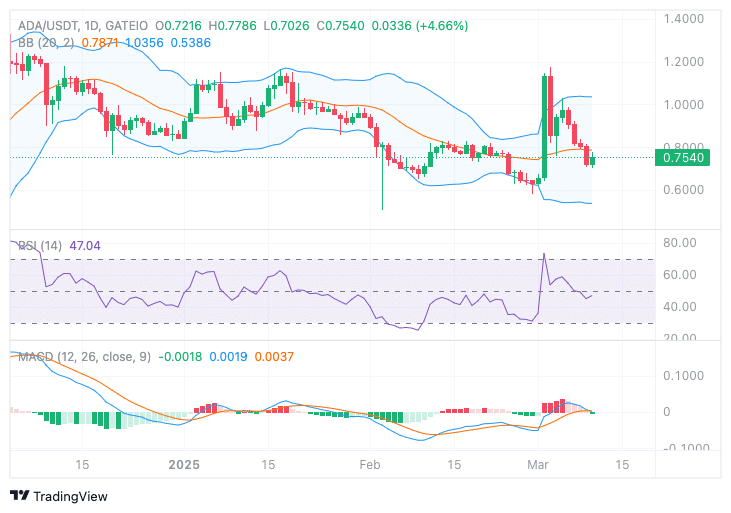
Market indicators show mixed signals for ADA. The Bollinger Bands indicate that ADA is currently near the lower band at $0.5386, suggesting potential oversold conditions.
The middle band at $0.7871 is acting as immediate resistance, while the upper band at $1.0356 remains a key breakout level.
At press time, the Relative Strength Index (RSI) stood at 47.04, reflecting neutral conditions. If the RSI moves above 50, it could indicate growing buying pressure. However, a drop below 40 may signal increasing selling activity.
Source: TradingView
Furthermore, the MACD showed a bearish crossover, with the MACD line at -0.0018 below the signal line at 0.0019, pointing to a potential continuation of the downtrend unless momentum shifts.
Market activity and investor sentiment
According to Coinglass data, ADA’s trading volume has surged by 66.40% to $3.53 billion, indicating heightened market participation.
However, Open Interest has dropped by 9.49% to $831.18 million, suggesting traders are closing positions amid uncertainty. Meanwhile, options volume has declined by 92.94% to $6.59K, showing reduced speculative interest.
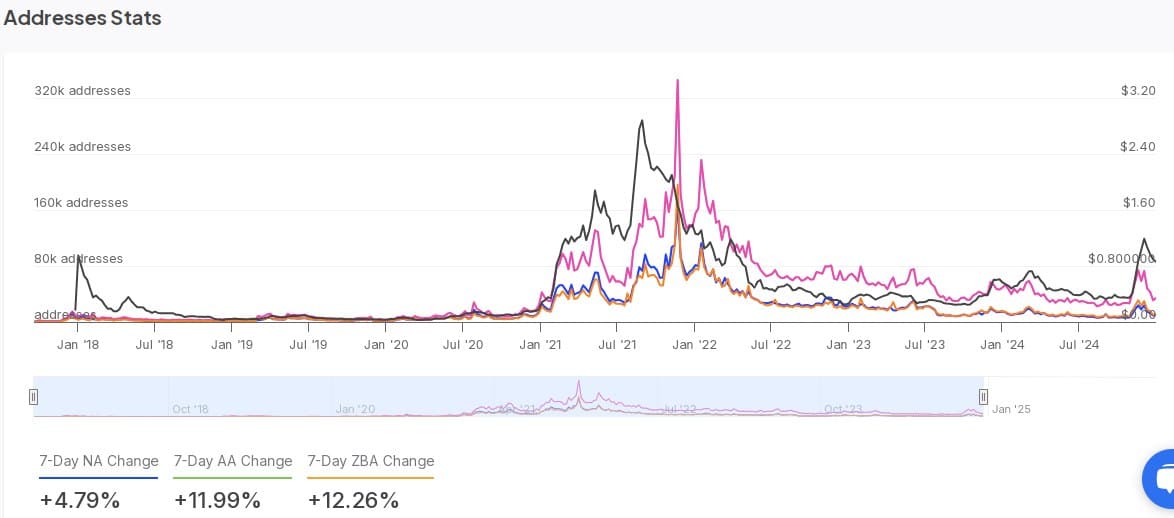
Address activity has seen an increase, as IntoTheBlock data reports a 7-day rise in active addresses (+11.99%), new addresses (+4.79%), and zero-balance addresses (+12.26%). This suggests renewed network engagement, despite ADA trading far below its all-time high of over $3.00 in 2021.
Source: IntoTheBlock
Declining large transactions raises concerns
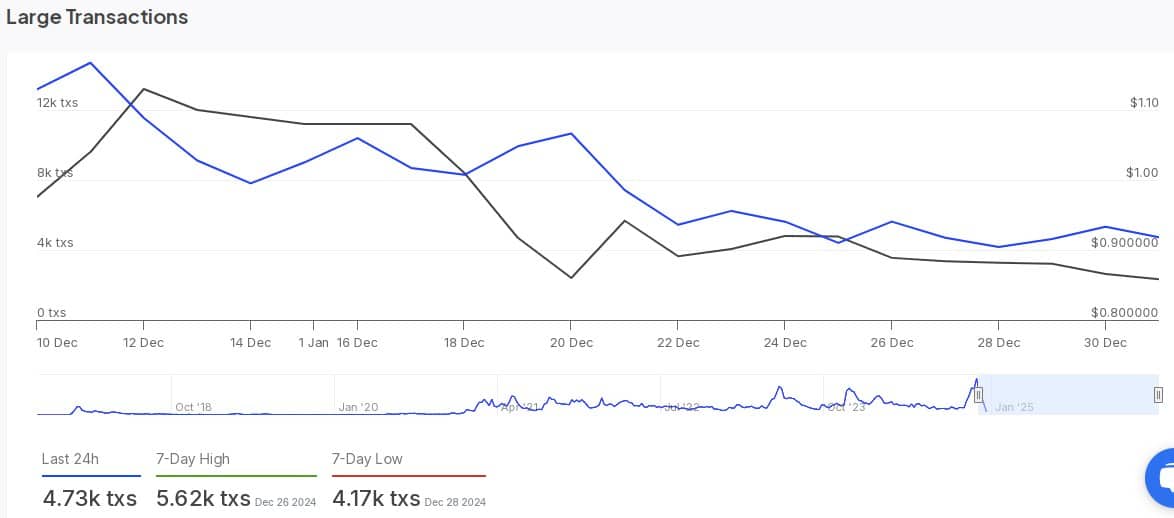
Whale activity has been on a downward trend, as shown in the large transactions chart. On the 10th of December, transactions peaked at 12K, but the number has since fallen to 4.73K in the last 24 hours.
Source: IntoTheBlock
This decline in large transactions suggests reduced interest from big investors, which may limit upward price movement.
At the time of writing, ADA was trading between $0.80 and $0.90, and its ability to stay above key support levels will determine whether it can regain momentum.
A rebound above $0.80 could trigger a move toward $1.00, while failure to hold $0.66 may push the price lower. As volatility remains high, traders will be watching closely to see if ADA can stabilize or if another downturn is on the horizon.