
Ethereum is still under significant bearish pressure, with the possibility that the downward trend might continue in the coming days or weeks as the market struggles to recover. After dropping sharply over the last few days, ETH may have finally reached that crucial moment that could trigger a significant upward surge.
A Strong Rally To New Highs On The Horizon For Ethereum?
During negative market conditions, Ethereum, the second-largest crypto asset, tends to decline along with other major digital assets like Bitcoin and Solana. ETH’s price has now fallen below $2,000 once again, raising uncertainty about a short-term upside breakout and reversal.
However, seasoned market expert and investor Trader Tardigrade points to a bullish development on the ETH’s chart that could lay the groundwork for a rebound and a rally. His prediction suggests that ETH is gearing up for a significant recovery as the altcoin enters a crucial oversold zone.
With Ethereum trending in an oversold zone, this implies that selling pressure may have reached exhaustion, which could pave the way for buying pressure. Once buying pressure returns, a new wave of optimism will be introduced to the market, increasing the likelihood of another rally.
According to the analyst, Ethereum has entered the oversold zone on the Stochastic indicator in a 3-year span. Besides determining overbought and oversold conditions, the key indicator is also used to gauge trend reversals and divergences.
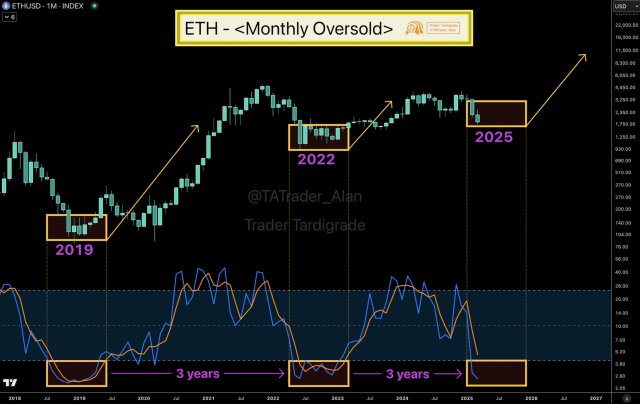
Considering the development, Trader Tardigrade believes that the altcoin may have reached the bottom at the current level. Historically, ETH has seen notable growth from the bottom, as seen in the monthly chart. The chart shows a similar trend in 2019 and 2022, in which each cycle spurred a strong rally.
These past scenarios provide more confirmation of Trader Tardigrade’s upsurge expectation. Should it mirror previous trends, the analyst foresees a move toward new all-time highs, mainly targeting the $11,500 mark. Many crypto experts have predicted that ETH’s path to the $10,000 milestone and beyond is programmed and natural.
ETH’s Upside Momentum Hinges On This Key Area
Ethereum is witnessing another day of bearish movement as its price loses the $1,900 support level. Delving into ETH’s current price action, Ali Martinez, a crypto expert and trader, has predicted the next possible move for the altcoin using the Market Value to Realized Value (MVRV) Pricing Bands.
After examining the MVRV Extreme Deviation Pricing Bands metric, Ali Marinez highlighted that ETH is testing key support levels that are crucial for its next move. If the realized price of $2,060 fails to hold, Martinez noted that the next significant support is located at $1,440, suggesting a potential deeper decline in ETH’s price.
At the time of writing, Ethereum was trading at $1,892, displaying a 0.30% drop in the last 24 hours. With ETH falling below the $1,900 mark, bearish sentiment has risen around the asset, as evidenced by a more than 37% decrease in its daily trading volume.
Featured image from Unsplash, chart from Tradingview.com

Editorial Process for bitcoinist is centered on delivering thoroughly researched, accurate, and unbiased content. We uphold strict sourcing standards, and each page undergoes diligent review by our team of top technology experts and seasoned editors. This process ensures the integrity, relevance, and value of our content for our readers.