
Reason to trust
Strict editorial policy that focuses on accuracy, relevance, and impartiality
Created by industry experts and meticulously reviewed
The highest standards in reporting and publishing
Strict editorial policy that focuses on accuracy, relevance, and impartiality
Morbi pretium leo et nisl aliquam mollis. Quisque arcu lorem, ultricies quis pellentesque nec, ullamcorper eu odio.
The on-chain analytics firm Glassnode has revealed in a report how the Bitcoin investors have seen a shift toward strong distirbution recently.
Bitcoin Accumulation Trend Score Has Been At A Low Level Recently
In its latest weekly report, Glassnode has talked about the latest trend in the Bitcoin Accumulation Trend Score. The “Accumulation Trend Score” is an indicator that tells us about the degree of accumulation that the BTC investors as a whole are participating in.
Related Reading
The indicator calculates its value not just by looking at the balance changes that happened in investor wallets over the past month, but also by weighing said changes against the size of the holdings themselves.
When the value of the metric is close to 1, it means the large investors (or a large number of small entities) are adding to their holdings. On the other hand, it being near 0 suggests the market is observing distribution, or simply, a lack of accumulation.
Now, here is the chart shared by the analytics firm that shows the trend in the Bitcoin Accumulation Trend Score over the last couple of years:
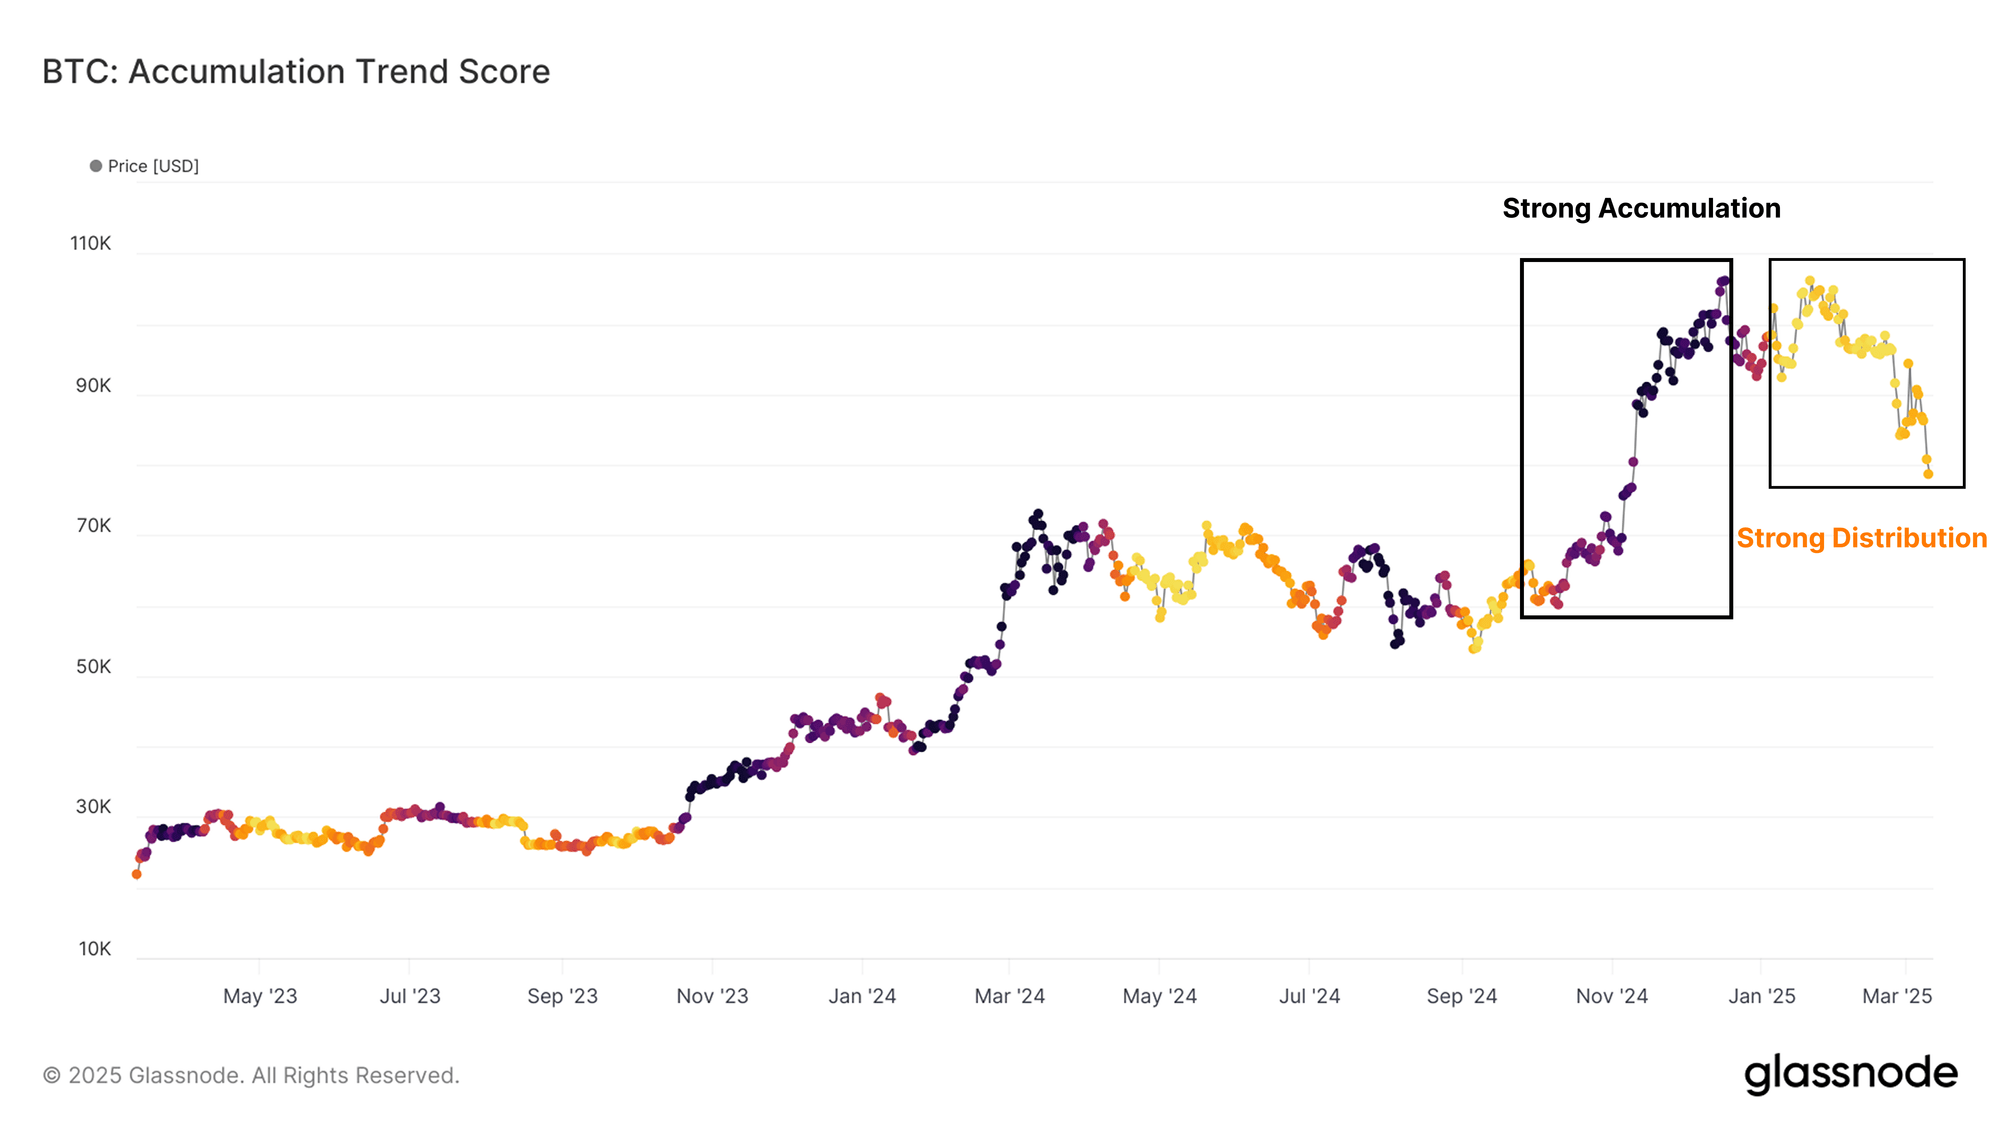
In the chart, the dark shades correspond to values related to accumulation, while the light ones to distribution. It’s apparent that the market was seeing the Accumulation Trend Score sitting at a very dark shade during the last couple of months of 2024, meaning that heavy accumulation was taking place
This strong accumulation from the large entities was likely what fueled the price rally to new all-time highs (ATHs). A similar phase of buying was also seen during the first quarter of 2024 and the asset enjoyed a rally then as well.
From the chart, it’s visible that this previous period of accumulation was followed by a phase of strong distribution. It would appear that a similar pattern has also emerged this time, as the Accumulation Trend Score has been flashing distribution values since January.
Last year, the distribution phase kicked off a long period of consolidation for Bitcoin, but this time, the cryptocurrency has outright seen a significant decline. It’s possible that as long as the Accumulation Trend Score remains in this zone, the coin’s price will continue to suffer.
While the Accumulation Trend Score is a useful indicator for gauging the trend being followed by the market as a whole, the metric can hide the granular details related to market behavior. Glassnode has shared another metric in the the report, that contains these details by looking at how much buying last occurred at particular cost basis levels.
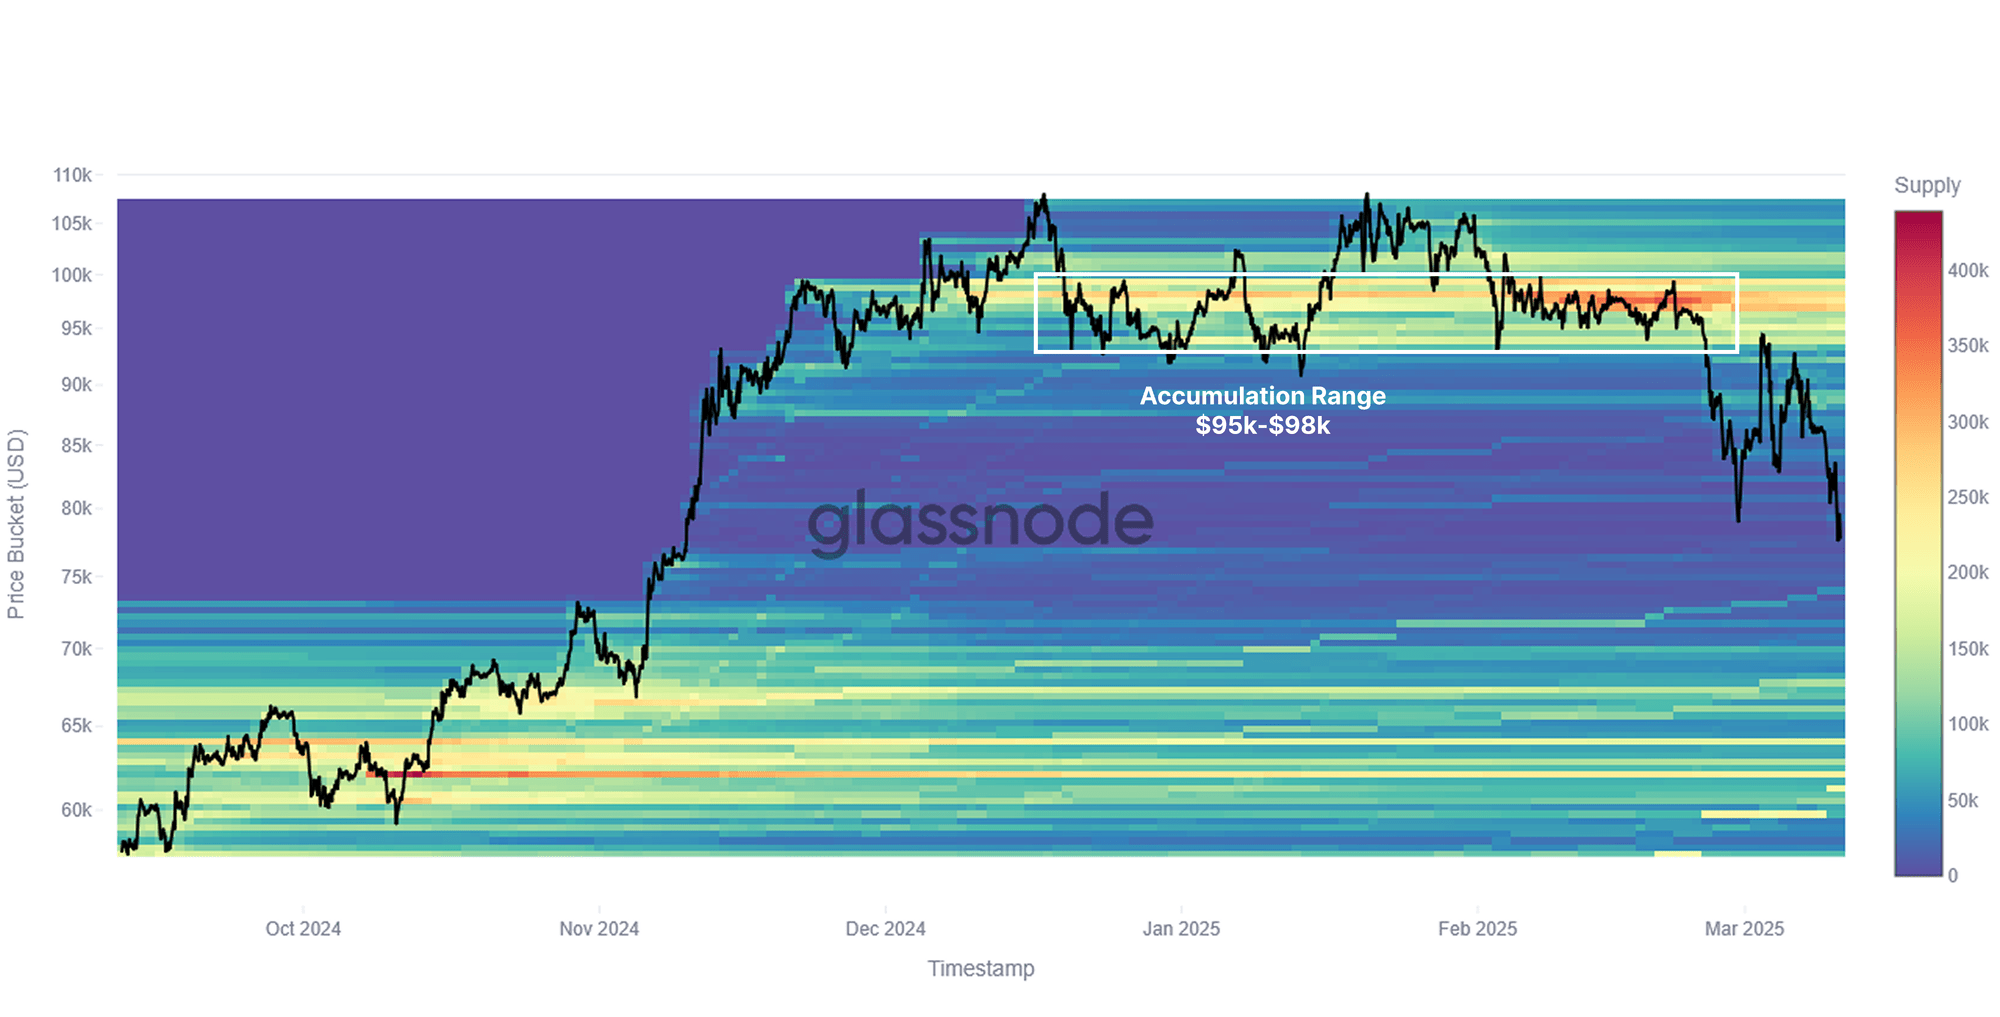
As the analytics firm has highlighted in the chart, the Bitcoin investors were buying the ‘dip’ when BTC first entered into this bearish phase, implying they still believed the bull run to be on.
Related Reading
During the latest crash, however, this hasn’t been the case, as these price levels still don’t host the cost basis of any significant part of the supply.
BTC Price
Bitcoin fell under $77,000 earlier in the week, but the asset has since been making some recovery as its price is now back at $82,500.

Featured image from Dall-E, Glassnode.com, chart from TradingView.com