Reason to trust
Strict editorial policy that focuses on accuracy, relevance, and impartiality
Created by industry experts and meticulously reviewed
The highest standards in reporting and publishing
Strict editorial policy that focuses on accuracy, relevance, and impartiality
Morbi pretium leo et nisl aliquam mollis. Quisque arcu lorem, ultricies quis pellentesque nec, ullamcorper eu odio.
In an X post published yesterday, crypto analyst Matthew Hyland highlighted that according to the weekly timeframe chart, Bitcoin (BTC) is likely to test the support level between $69,000 to $74,000 in the coming months.
Is The Bitcoin Bottom In?
Hyland noted that BTC’s weekly resistance level currently hovers around the $90,500 level. The analyst emphasized that if BTC has a weekly close above $89,000, then it may indicate that the market bottom is in. He added:
If we do get a weekly close above this area ($89,000 to $91,000), I think the low is in for Bitcoin, and we are not going down to this area.
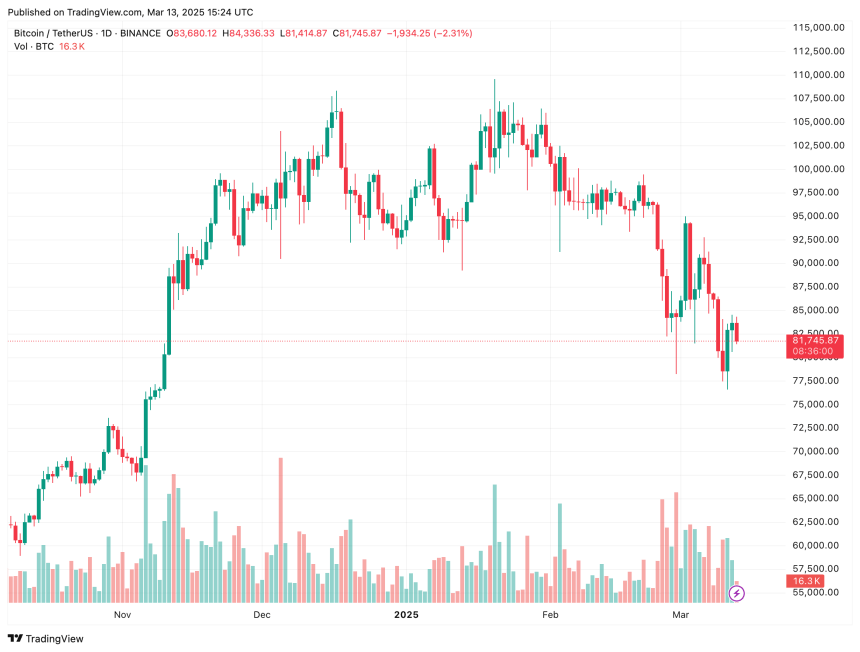
To recall, BTC last traded above $89,000 earlier this month on March 9. From there, the cryptocurrency experienced a breakdown to lower price levels, primarily due to rising macroeconomic uncertainties due to US President Donald Trump’s trade tariffs on numerous countries.
Related Reading
According to data from cryptocurrency exchange Binance, after failing to defend the $89,000 level, BTC ended up falling as low as $76,606 on March 10. Since then, the digital asset has made slight recovery, buoyed by lower than anticipated US CPI inflation data and is currently trading in the low $80,000 level.
BTC Faces Strong Resistance At $86,100
Similarly, in a recent Quicktake post on CryptoQuant, analyst Yonsei_dent highlighted the significance of short-term holder (STH) Realized Price in determining the digital asset’s future price trajectory.
Related Reading
For the uninitiated, Bitcoin’s Realized Price refers to the average acquisition cost of investors while STH refers to holders who have held BTC for less than six months. These investors are typically more sensitive to market movements.
The analyst remarked that the weighted average Realized Price for STHs who have held BTC for one week to six months lies around $91,800, suggesting that these investors are currently in a loss position.
The three months to six months STH cohort has a Realized Price of $86,100, denoting a strong resistance level for the digital asset in the short-term. Notably, this group of holders has the highest share of Realized Cap among STHs, hinting that selling pressure could magnify around this price level.
With regard to major support levels, long-term holders (LTH) with a holding time of six months to twelve months have a Realized Price of $63,700. The post adds:
The highest volume profile over the past year is concentrated around $64,000. This reinforces the idea that this area could serve as a strong support level.
If BTC fails to clear some of its immediate resistance levels, there is a high possibility that it may follow Arthur Hayes prediction of finding a bottom around $70,000. That said, several indicators suggest that BTC may be undervalued at its current market price. At press time, BTC trades at $81,745, up 0.7% in the past 24 hours.

Featured image from Unsplash, chart from TradingView.com

