
Bitcoin (BTC) breached a rising support trendline against gold (XAU), which has been intact for over 12 years, on March 14.
XAU/BTC ratio weekly performance chart. Source: TradingView/NorthStar
Popular analyst NorthStar says this breakdown could spell the end of Bitcoin’s 12-year bull run if it stays under the gold trendline for even a week or—worse—a month.
Is Bitcoin’s bull market over? Let’s take a closer look at BTC’s correlation with gold.
Gold hits new record high as Bitcoin’s uptrend cools
The BTC/XAU ratio breakdown occurred as spot gold rates hit a new record high above $3,000 per ounce on March 14, after rising by about 12.80% year-to-date.
In contrast, Bitcoin, which is often called “digital gold,” has dropped by 11% so far in 2025.
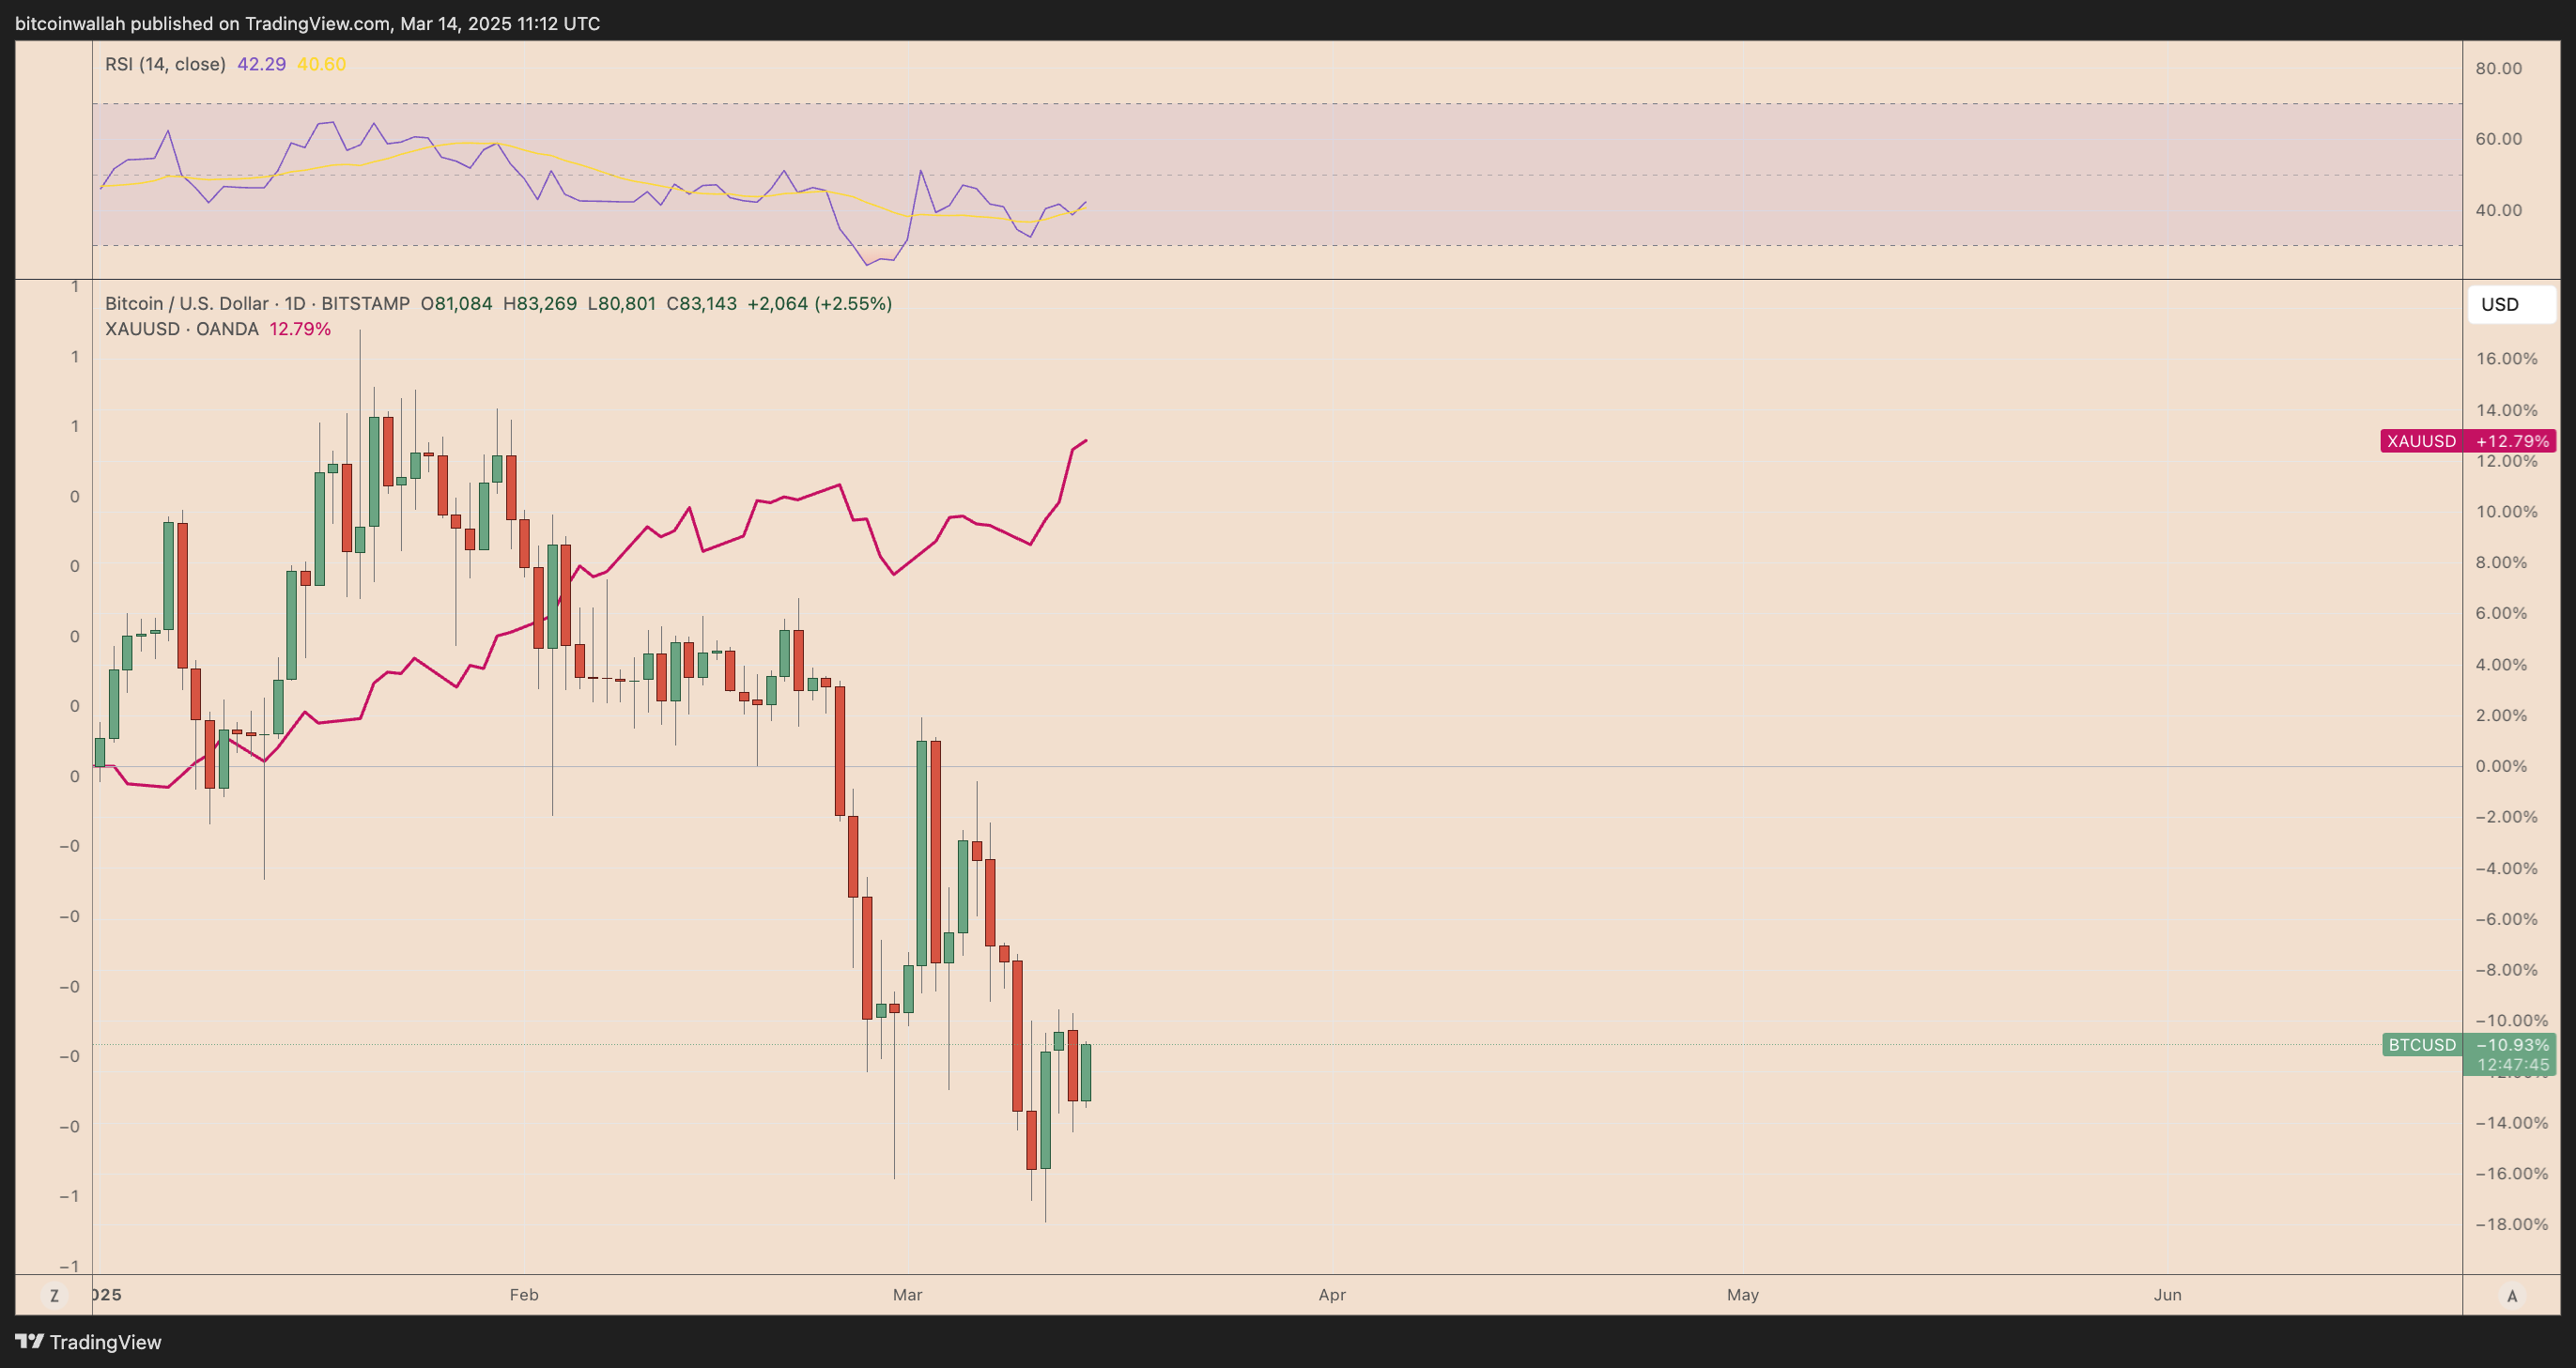
BTC/USD vs. XAU/USD YTD performance chart. Source: TradingView
The performances reflect the contrasting net flows into US-based spot exchange-traded funds (ETF) tracking Bitcoin and gold.
For instance, as of March 14, the US-based spot gold ETFs had collectively attracted over $6.48 billion YTD, according to data resource World Gold Council. Globally, gold ETFs have seen $23.18 billion in inflows.
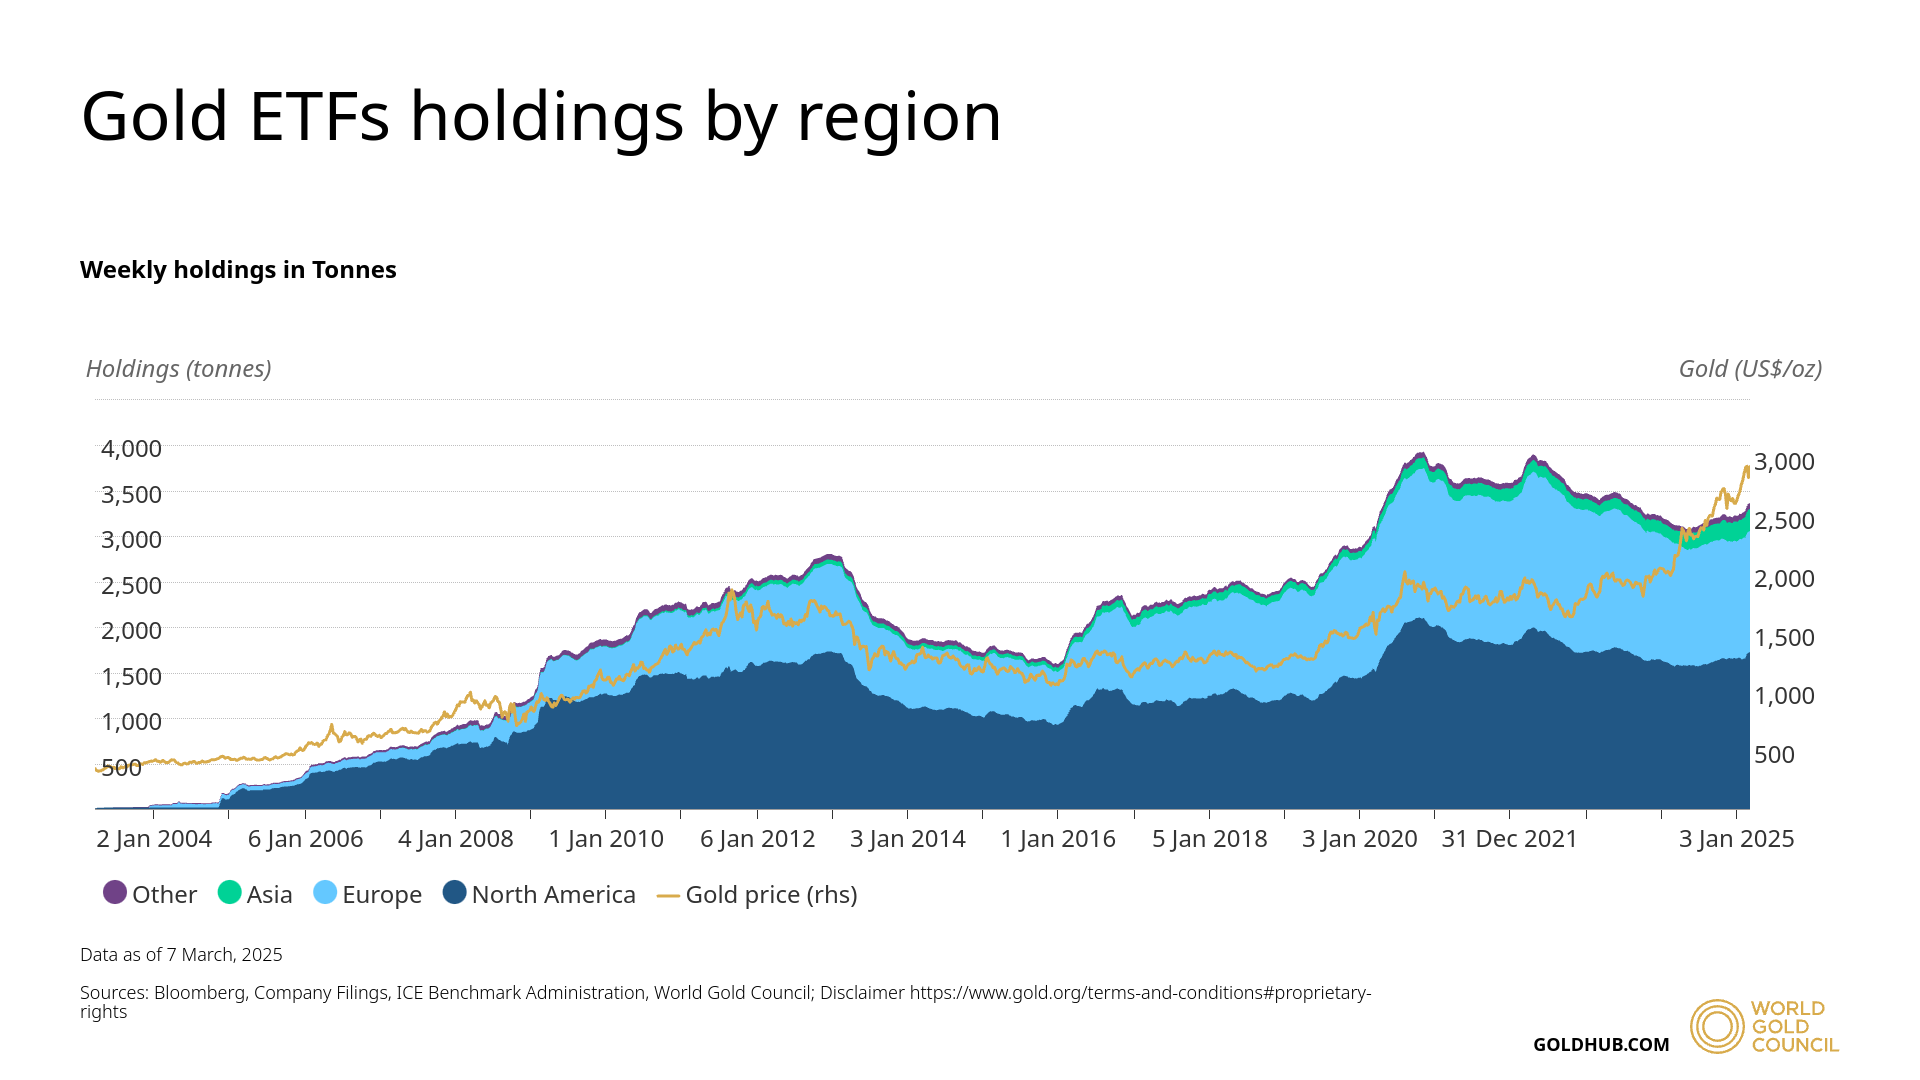
Gold ETFs weekly holdings by region. Source: GoldHub.com
On the other hand, US-based spot Bitcoin ETFs saw nearly $1.46 billion in outflows YTD, according to onchain data platform Glassnode.
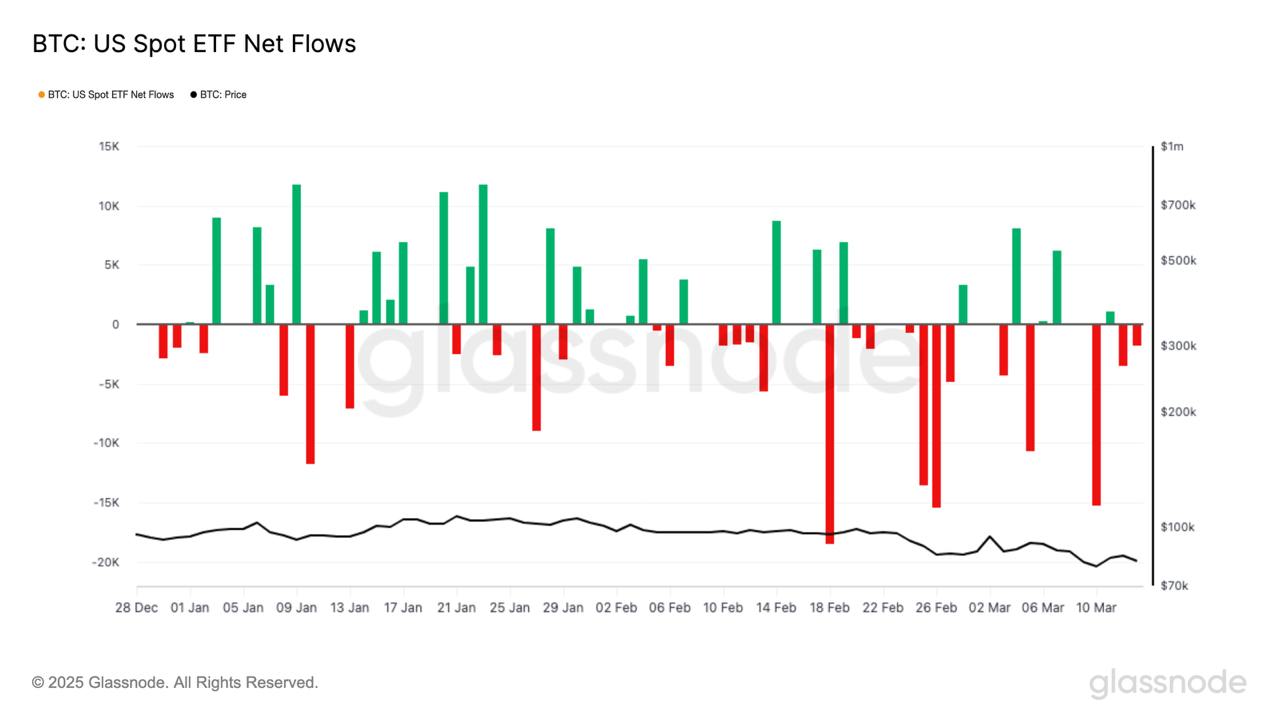
US Bitcoin ETFs year-to-date net flows. Source: Glassnode
The driving force behind this divergence lies in growing macroeconomic uncertainty and risk-off sentiment, exacerbated by President Donald Trump’s aggressive trade policies.
Related: Bitcoin panic selling costs new investors $100M in 6 weeks — Research
New tariffs on China, Mexico, and Canada have heightened fears of a global economic slowdown, pushing investors toward traditional safe-haven assets like gold.
Meanwhile, central banks, including those in the US, China, and the UK, have accelerated their gold purchases, further boosting gold prices.
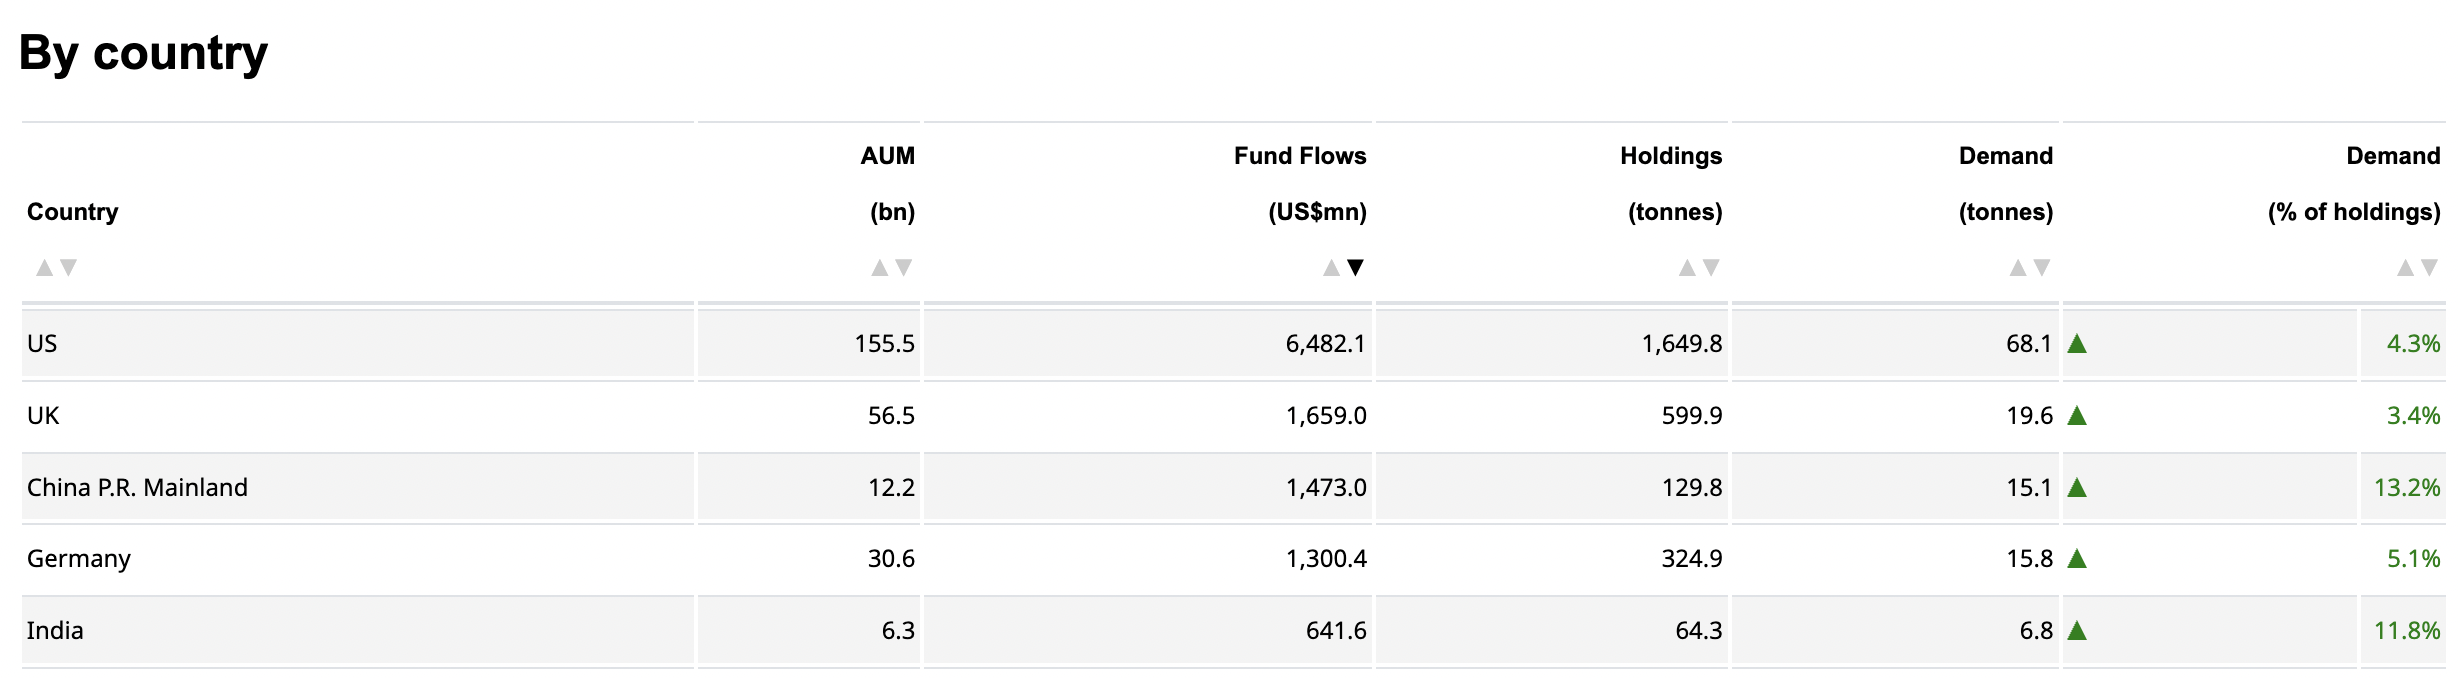
Countries that acquired the most gold so far in 2025. Source: GoldHub.com
In contrast, Bitcoin is mirroring the broader risk-on market. As of March 14, its 52-week correlation coefficient with the Nasdaq Composite index was 0.76.
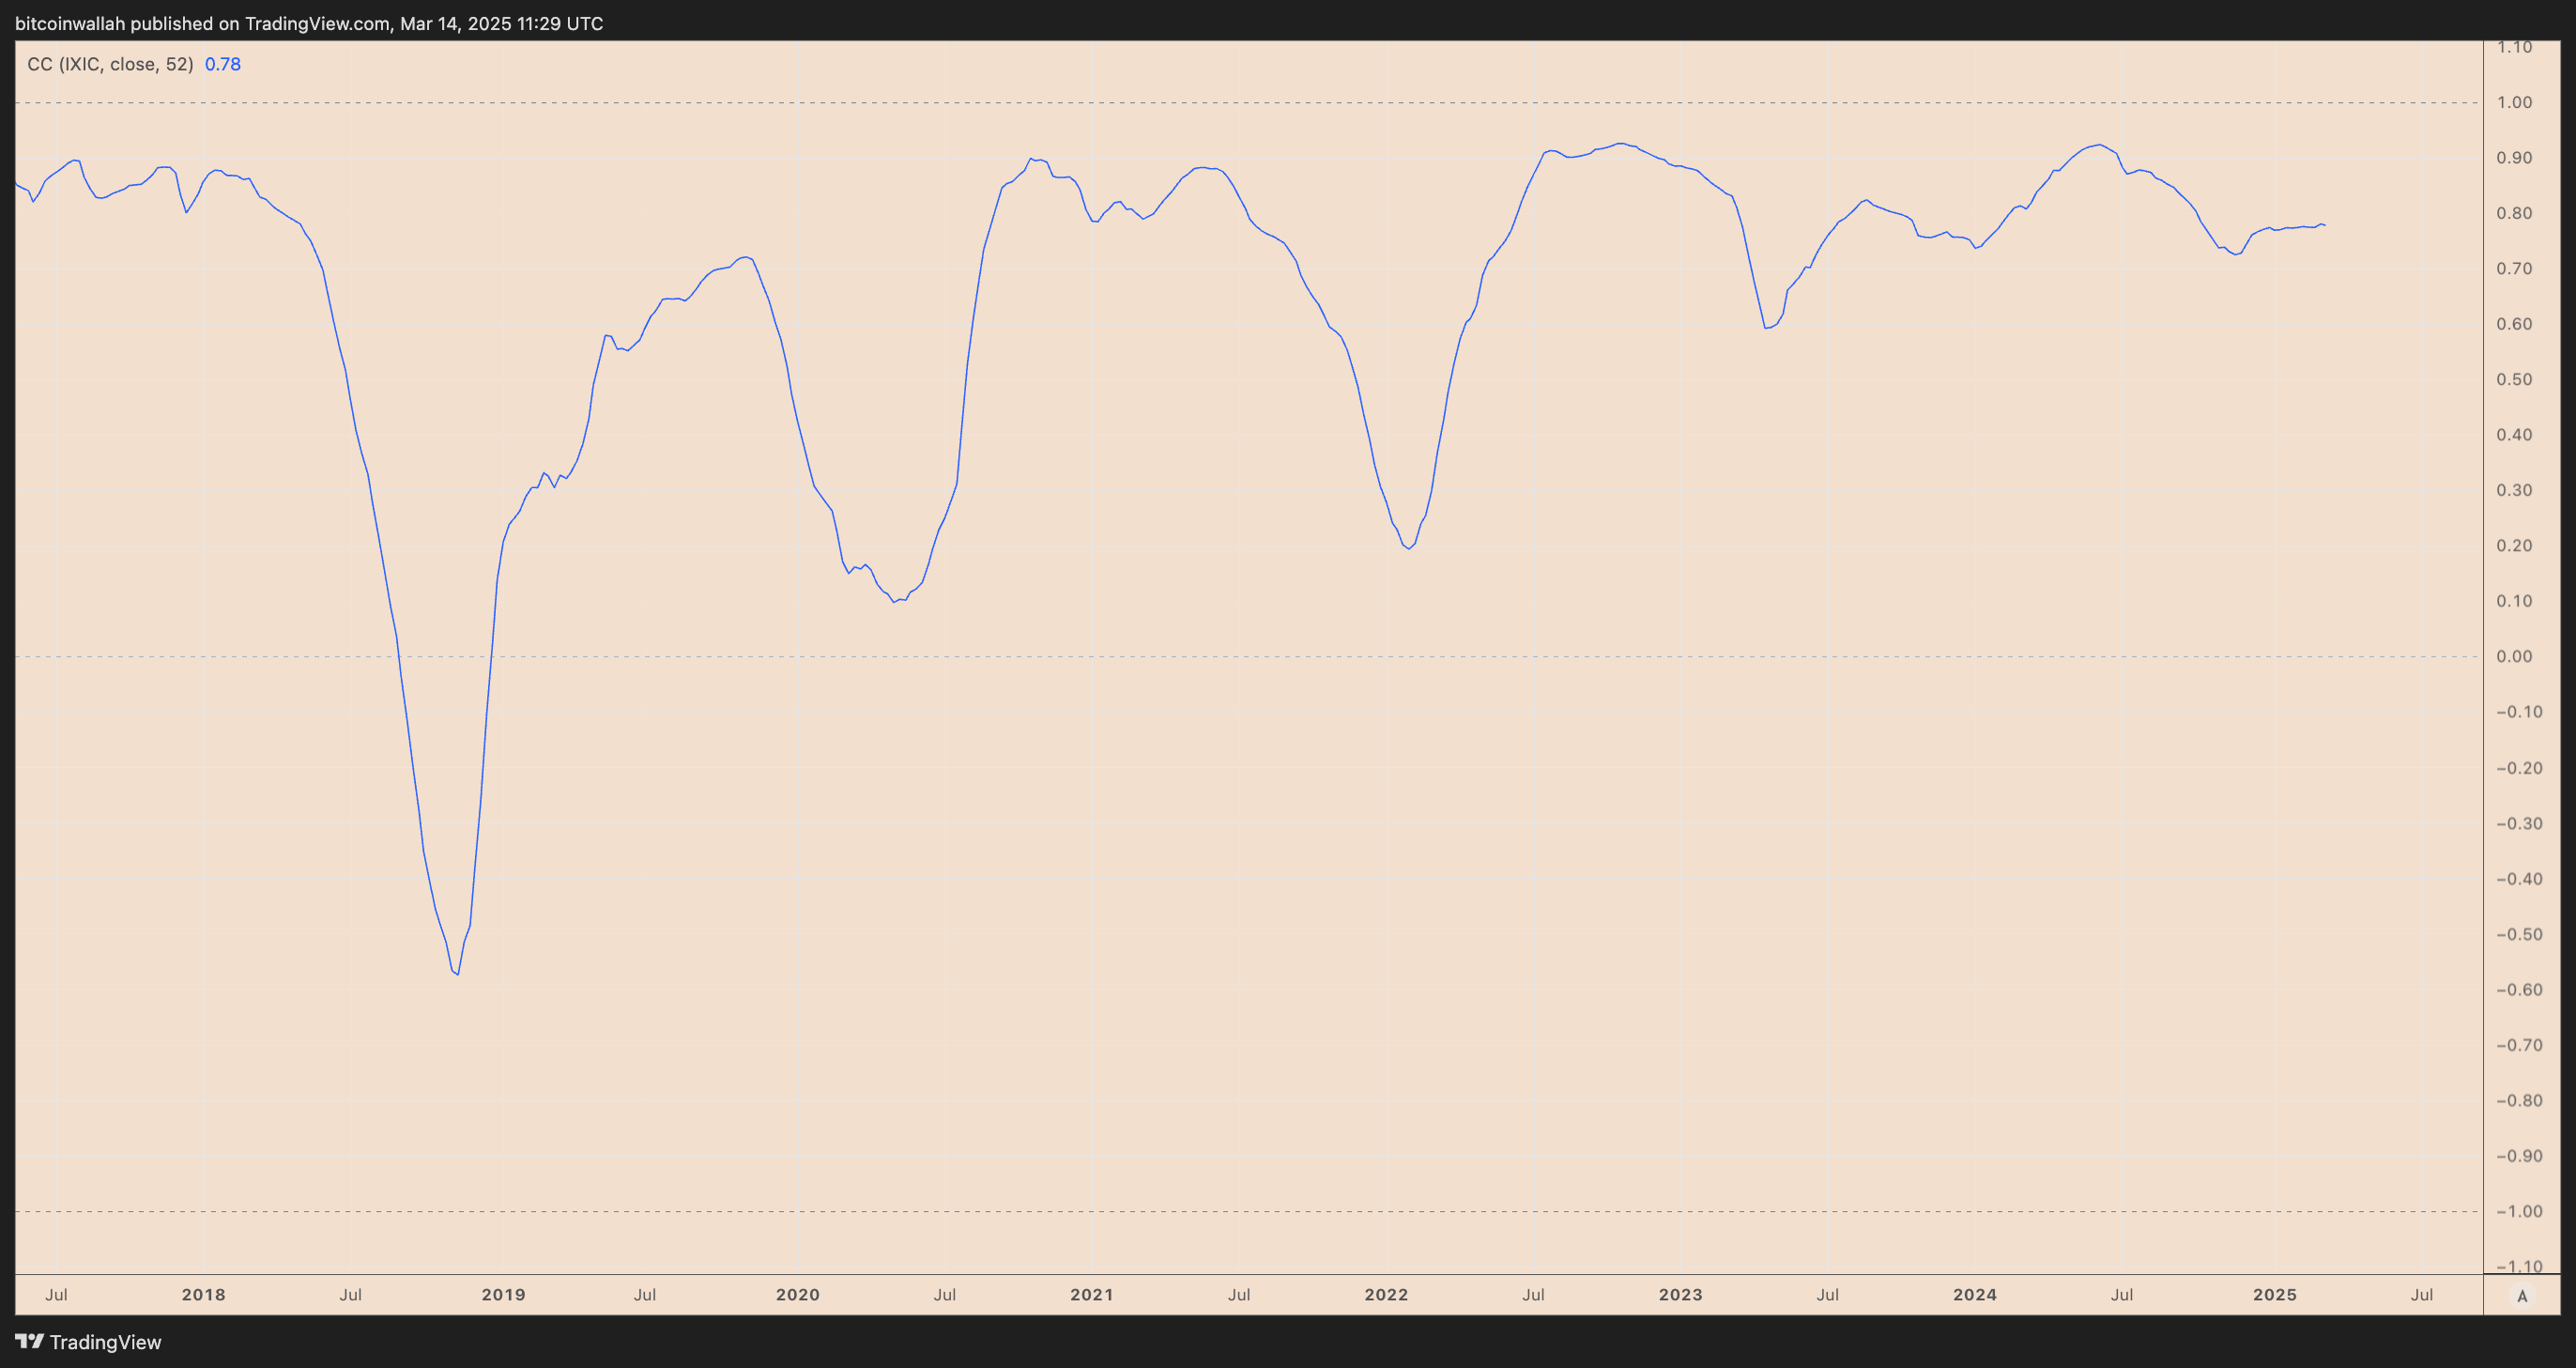
BTC/USD vs. Nasdaq Composite 52-week correlation coefficient chart. Source: TradingView
Has Bitcoin price topped?
The current Bitcoin-to-gold breakdown aligns with historical patterns, particularly the March 2021–March 2022 fractal, which preceded the last bear market.
At that time, the BTC/XAU ratio exhibited a bearish divergence, characterized by rising prices juxtaposed against a declining relative strength index (RSI). This pattern suggested diminishing upward momentum.
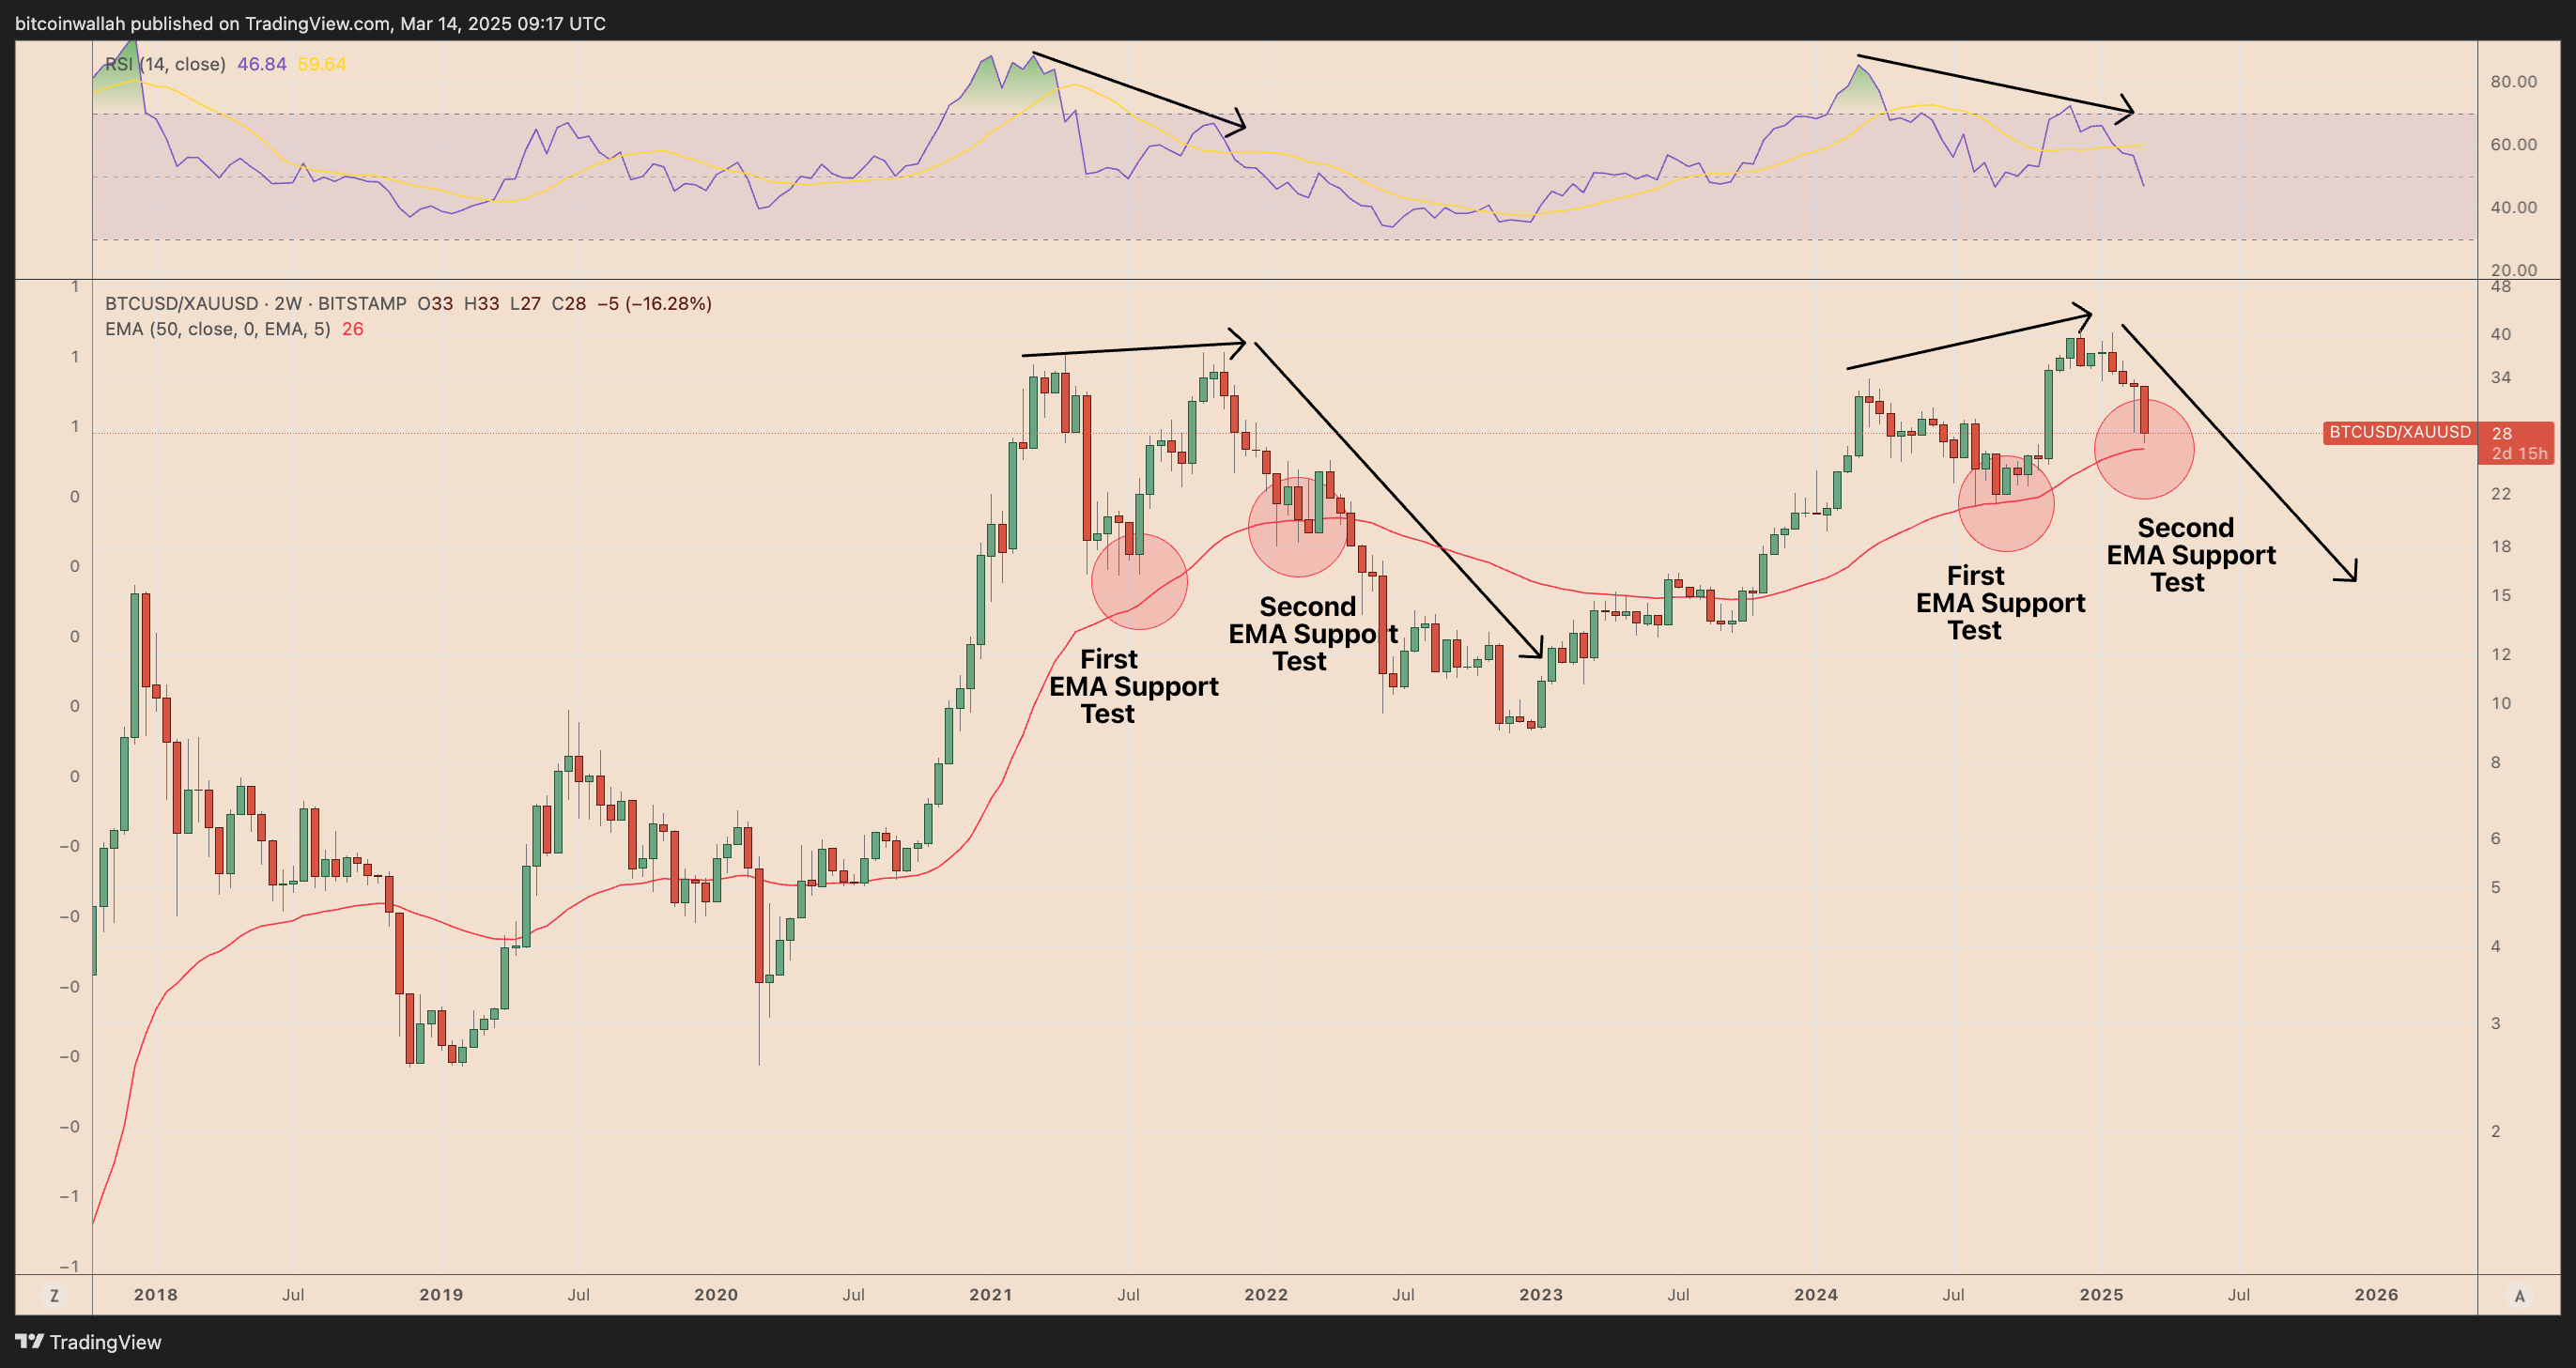
BTC/XAU ratio two-week performance chart. Source: TradingView
Consequently, the ratio initially retreated toward the 50-period, two-week exponential moving average (EMA) support level before ultimately plummeting by 60%.
That BTC/XAU breakdown period coincided with Bitcoin’s 68% correction against the US dollar.
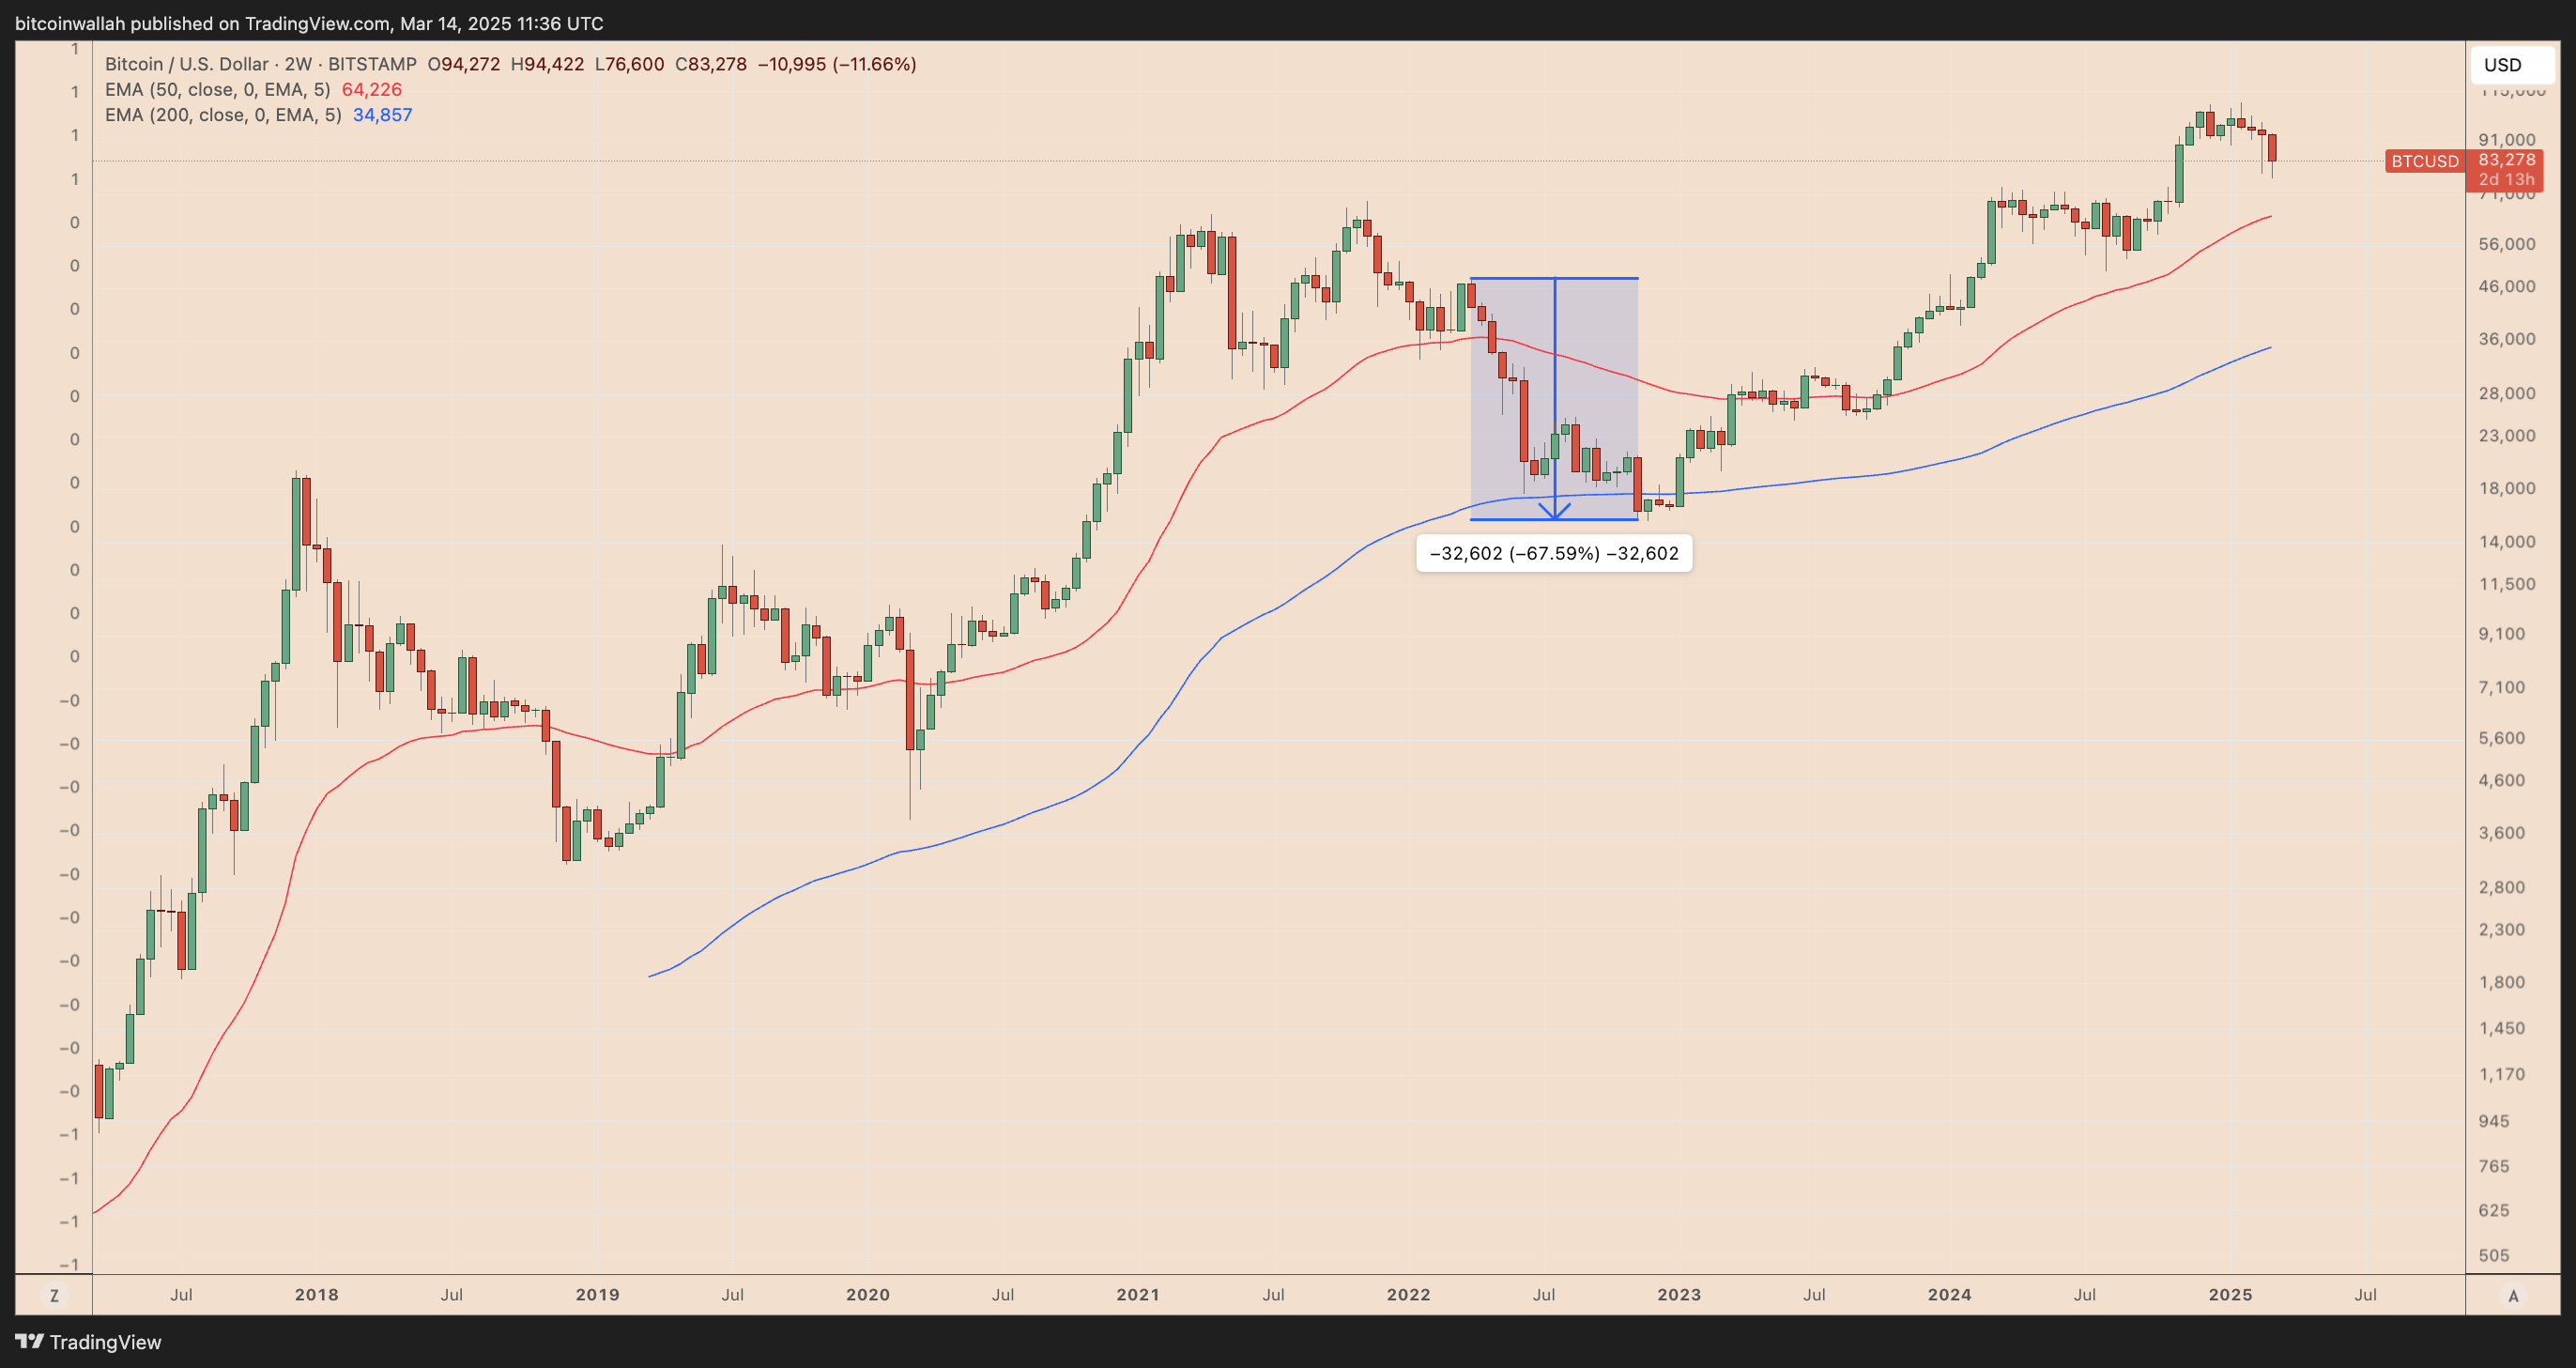
BTC/USD two-week performance chart. Source: TradingView
BTC/XAU has once again completed a two-phase EMA retest, echoing the 2021–2022 fractal.
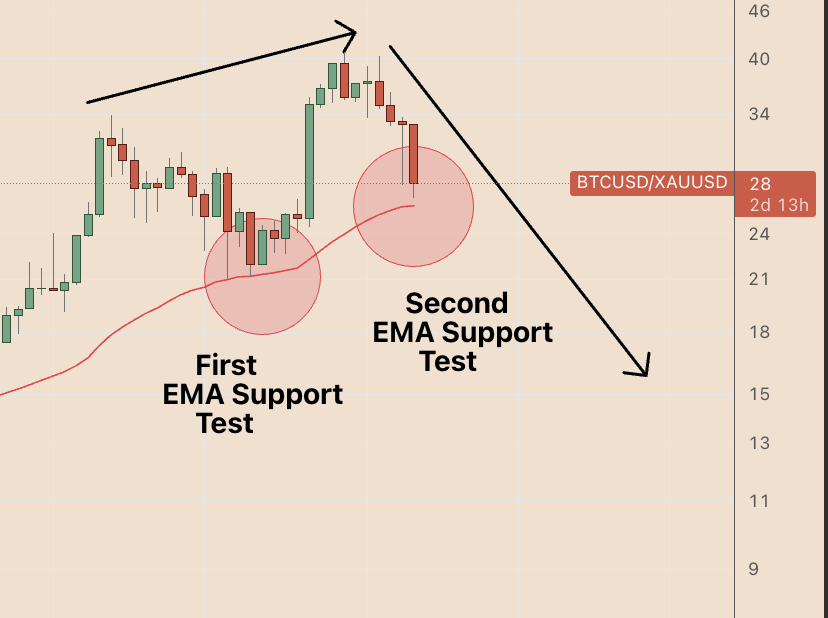
BTC/USD two-week performance chart (zoomed). Source: TradingView
With the RSI showing bearish divergence, momentum appears to be fading, increasing the probability of further declines, especially if the ratio drops decisively below the 50-2W EMA support (~26 XAU).
As a result, it could also indicate Bitcoin’s increased vulnerability to price declines in dollar terms, with the 50-2W EMA below $65,000 acting as the next potential downside target.
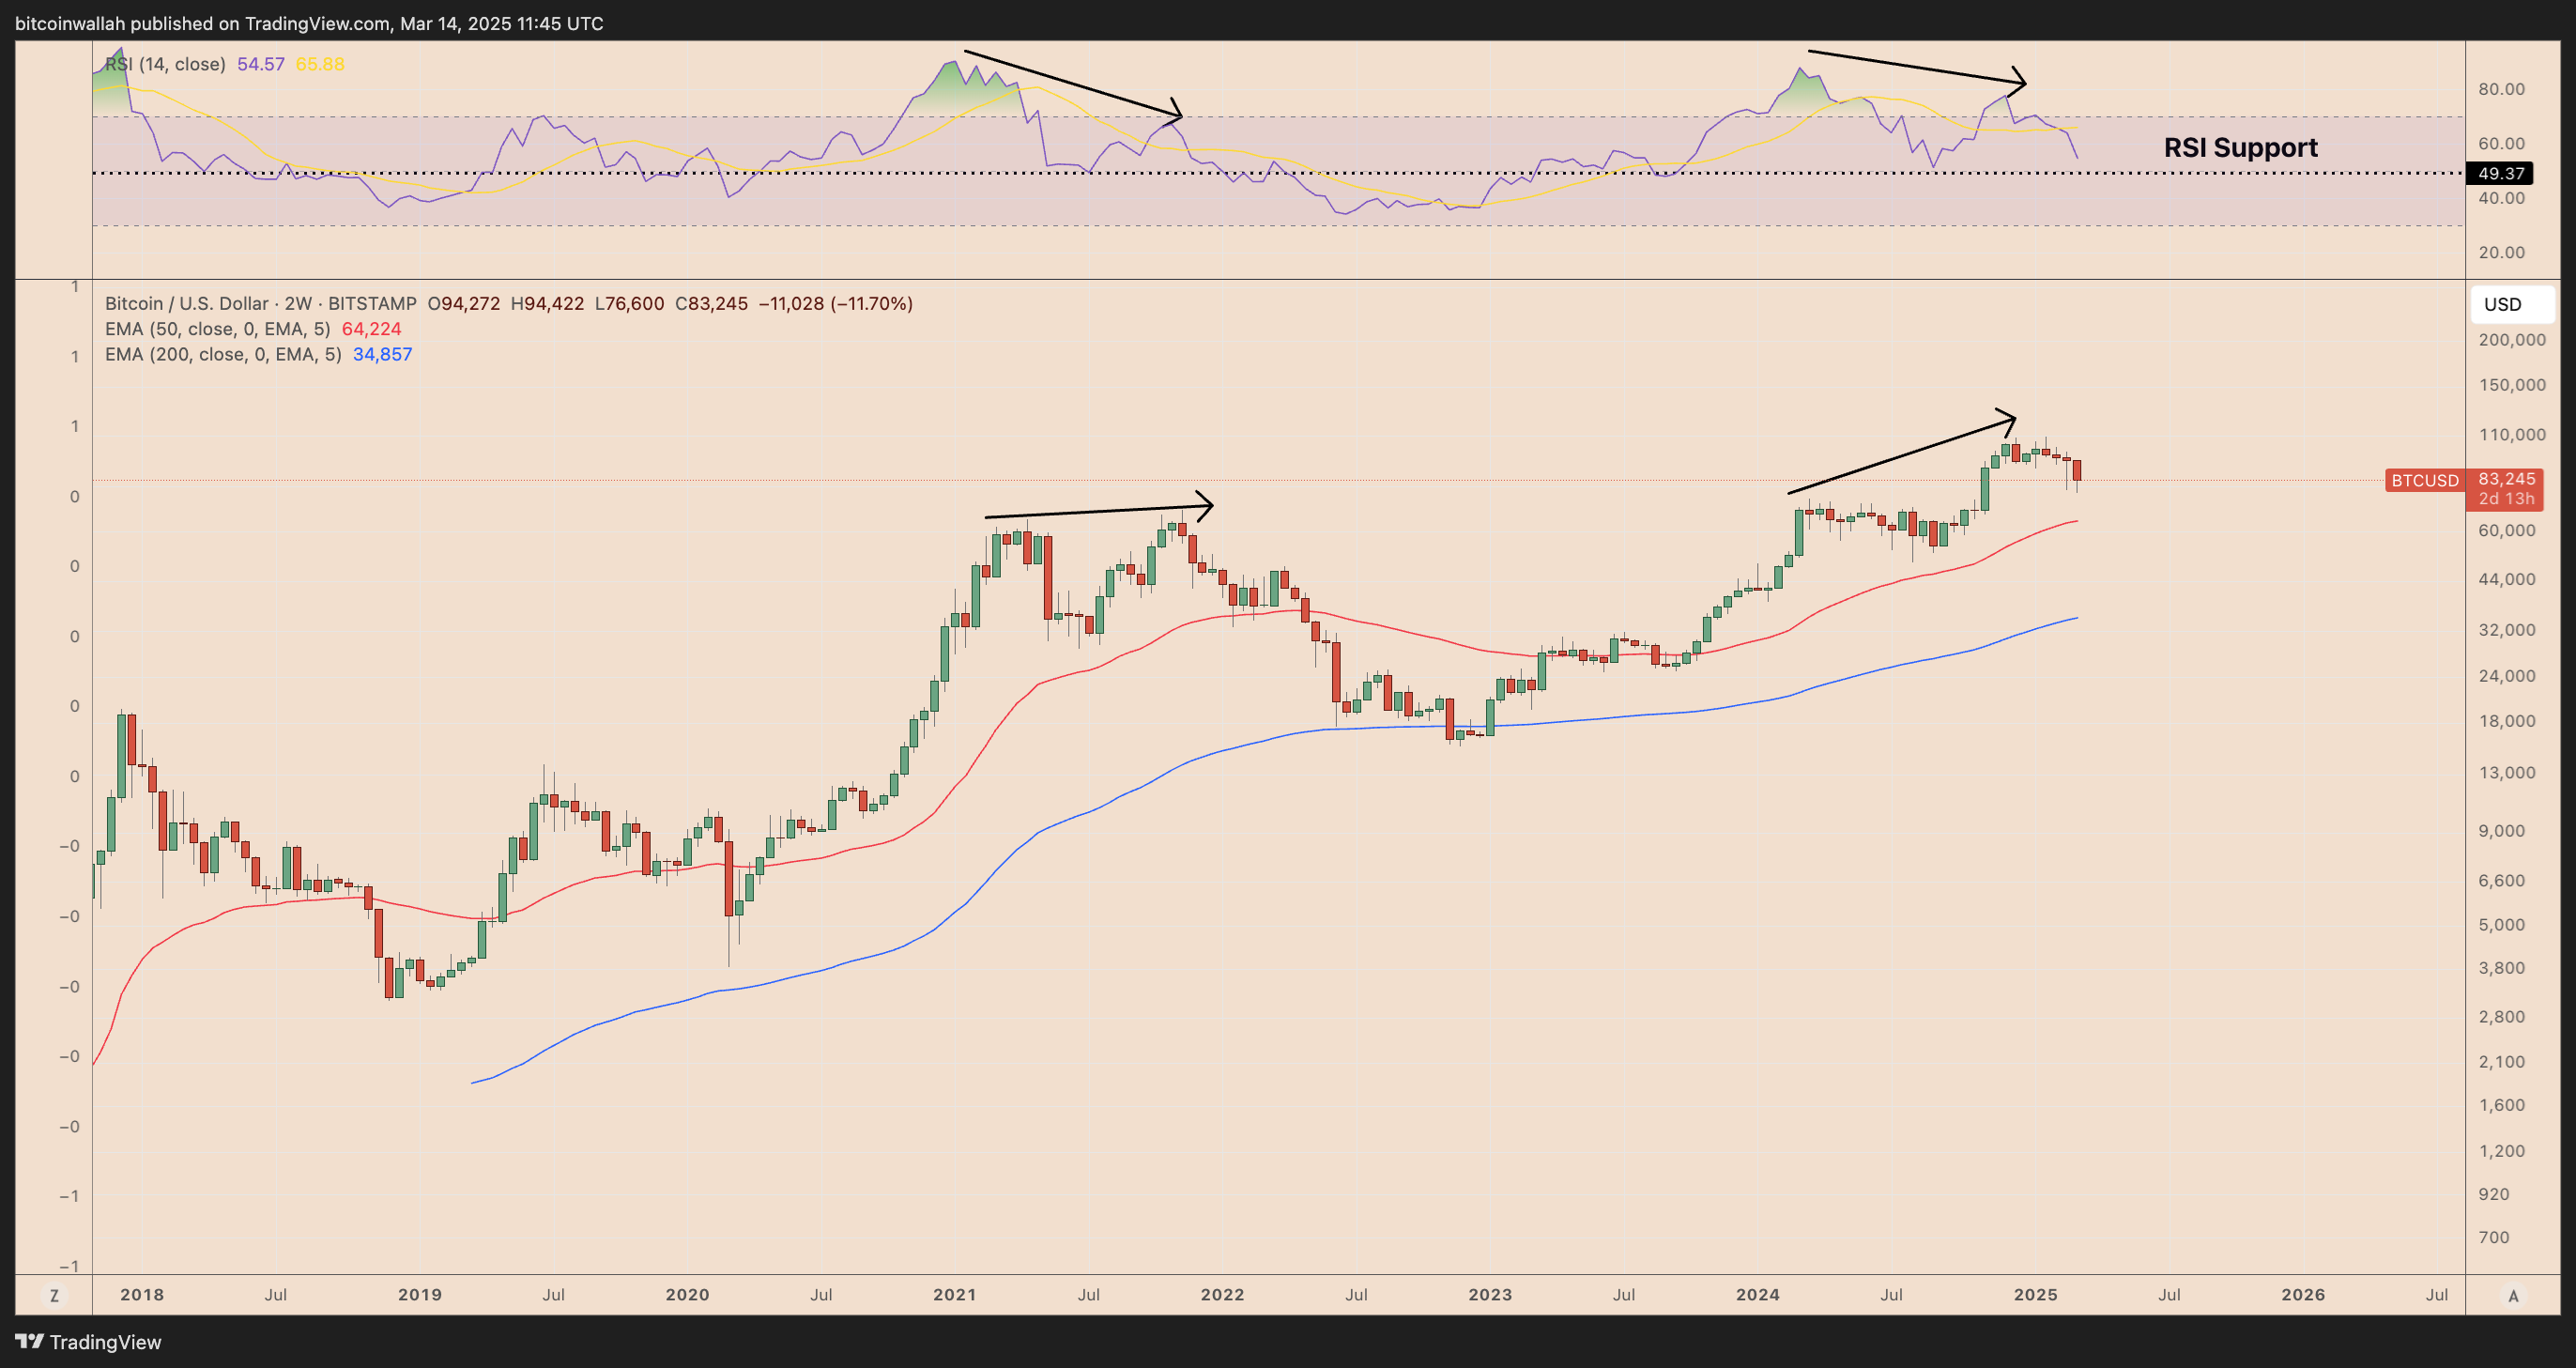
BTC/USD 2W price performance chart. Source: TradingView
That is down about 40% from Bitcoin’s record high of around $110,000 established in January.
Still, Nansen analysts consider such a decline as a “correction within a bull market,” raising possibilities of a bullish revival if the 50-2W EMA holds as support. However, a definitive break below the EMA could thrust Bitcoin into bear market territory.
That could drag Bitcoin’s 2025 downside target toward the 200-period two-week EMA (the blue wave) to as low as $34,850 if this Bitcoin-gold fractal repeats.
This article does not contain investment advice or recommendations. Every investment and trading move involves risk, and readers should conduct their own research when making a decision.