Close Menu
    What's Hot

    Ethereum Prepares For A Parabolic Move – ETH/BTC Chart Signals Strong Bullish Setup

    Ethereum Enters Strategic Pause: Will Accumulation Below Resistance Spark A Surge?

    Solana indicators point north, bulls test $165 target

    Facebook X (Twitter) Instagram
    yeek.io
    • Crypto Chart
    • Crypto Price Chart
    X (Twitter) Instagram TikTok
    Trending Topics:
    • Altcoin
    • Bitcoin
    • Blockchain
    • Crypto News
    • DeFi
    • Ethereum
    • Meme Coins
    • NFTs
    • Web 3
    yeek.io
    • Altcoin
    • Bitcoin
    • Blockchain
    • Crypto News
    • DeFi
    • Ethereum
    • Meme Coins
    • NFTs
    • Web 3
    Meme Coins

    FLOKI price prediction – November’s rally is lost, but here’s what’s coming next!

    Yeek.ioBy Yeek.ioDecember 1, 2024No Comments2 Mins Read
    Share Facebook Twitter Pinterest Copy Link Telegram LinkedIn Tumblr Email
    Share
    Facebook Twitter LinkedIn Pinterest Email
    • FLOKI seemed to have a bullish structure on the daily timeframe
    • It retested the $0.000202 support, but lacked the demand to push higher

    FLOKI, at the time of writing, was up 2.37% for the day as Bitcoin [BTC] tried valiantly to climb past the $97k-mark. In fact, while Bitcoin displayed some short-term bullish momentum over the past two days, so did FLOKI.

    The memecoin’s inability to break the high it made in March, however, and the following downtrend in June fueled fears that a similar scenario could be replayed.

    FLOKI momentum and demand slow down

    FLOKI 1-day TradingView

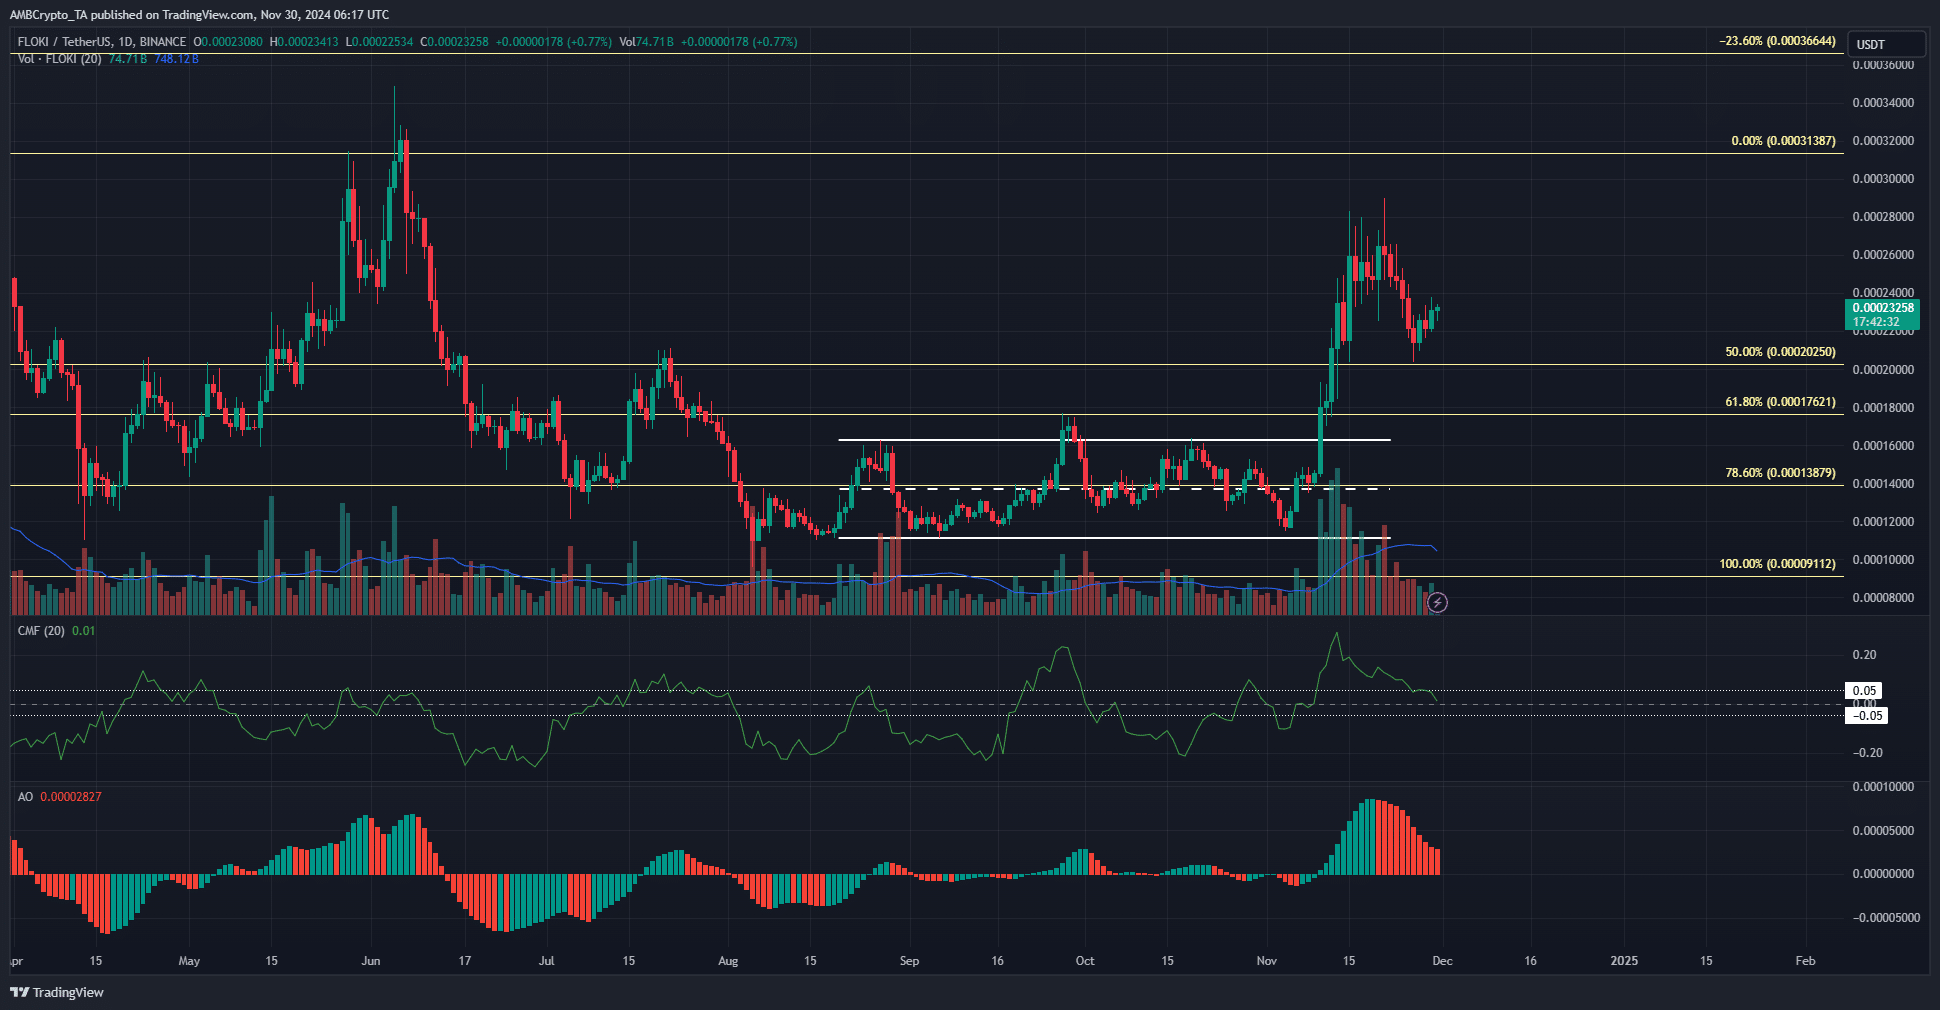
    Source: FLOKI/USDT on TradingView

    From August to November, FLOKI traded within a range (white) that extended from $0.000111 to $0.000165. This range’s mid-point coincided with the 78.6% retracement level at $0.000138.

    The breakout beyond the range on 10 November occurred backed by high trading volume. This rally reached as high as $0.00029 on 21 November, but it has receded since then.

    This price drop was accompanied by a fall in trading volume and buying pressure. The CMF on the daily timeframe has been in a steady slump over the past week and stood at +0.01 to show that capital flow was neutral.

    The Awesome Oscillator also registered red bars on its histogram to capture the bearish momentum over the past few days. Together, they highlighted FLOKI’s retracement after its recent gains.

    Liquidation map hinted at deeper retracement
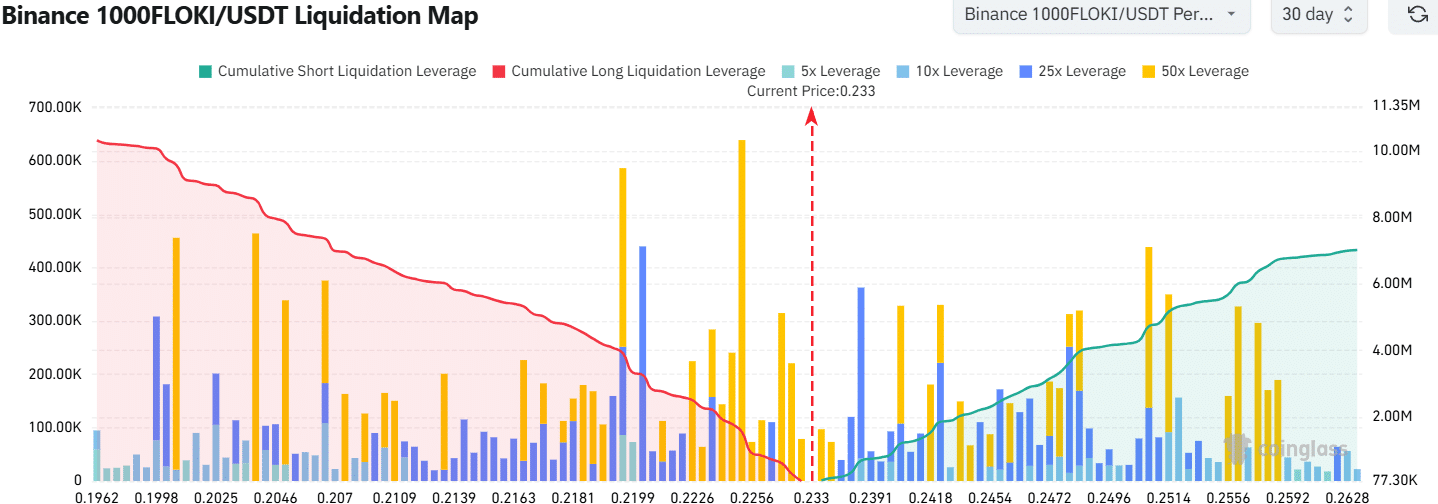
    FLOKI Liquidation MapFLOKI Liquidation Map

    Source: Coinglass

    FLOKI’s 1-month liquidation map highlighted the nearby long and short position liquidations. The $0.000225 and $0.000219 levels were close by and had high leverage long positions’ liquidations.


    Is your portfolio green? Check the FLOKI Profit Calculator


    In particular, $0.219 had a relatively high cumulative long liquidation leverage, and could attract prices to it. To the north, the cumulative short liquidation leverage was smaller, but the $0.000248-$0.00025 area could see a short-term bearish reversal.

    Disclaimer: The information presented does not constitute financial, investment, trading, or other types of advice and is solely the writer’s opinion

    Next: Can LINK’s buyers absorb incoming sell-side pressure after 52% November gains?

    Follow on Google News Follow on Flipboard
    Share. Facebook Twitter Pinterest LinkedIn Tumblr Email Copy Link
    Previous ArticleWeb3’s responsibility is to advance data privacy
    Next Article Pt 1: Personal Productivity Stack
    Avatar
    Yeek.io
    • Website

    Yeek.io is your trusted source for the latest cryptocurrency news, market updates, and blockchain insights. Stay informed with real-time updates, expert analysis, and comprehensive guides to navigate the dynamic world of crypto.

    Related Posts

    Dogecoin faces a sell wall – Will smart money hold or fold at $0.17?

    June 7, 2025

    Analyzing Dogecoin’s price recovery odds in the wake of Trump-Musk spat

    June 7, 2025

    Examining PENGU’s 9% pump – Will spot sell pressure ruin the bullish setup?

    June 7, 2025
    Leave A Reply Cancel Reply

    Advertisement
    Demo
    Latest Posts

    Ethereum Prepares For A Parabolic Move – ETH/BTC Chart Signals Strong Bullish Setup

    Ethereum Enters Strategic Pause: Will Accumulation Below Resistance Spark A Surge?

    Solana indicators point north, bulls test $165 target

    Cardano is at the Nexus of Bitcoin DeFi: Charles Hoskinson

    Popular Posts
    Advertisement
    Demo
    X (Twitter) TikTok Instagram

    Categories

    • Altcoin
    • Bitcoin
    • Blockchain
    • Crypto News

    Categories

    • Defi
    • Ethereum
    • Meme Coins
    • Nfts

    Quick Links

    • Home
    • About
    • Contact
    • Privacy Policy

    Important Links

    • Crypto Chart
    • Crypto Price Chart
    © 2025 Yeek. All Copyright Reserved

    Type above and press Enter to search. Press Esc to cancel.