The Bitcoin price recently achieved a monumental milestone, crossing the $100,000 threshold for the first time in its history. While the breakthrough is a significant achievement for the BTC price, it also raises the question of where it goes from here.
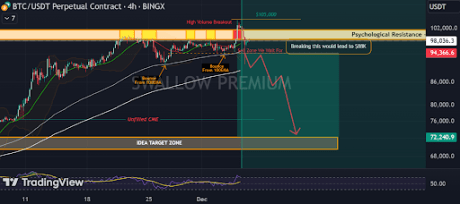
The consensus among many analysts is of a continued bullish price action for Bitcoin. However, a crypto analyst on TradingView has issued a stark warning, labeling this price point as a “dangerous zone.” According to their technical outlook, reaching $100,000 could cause a massive correction in the Bitcoin price up to the $72,000 price level.
Why $100,000 May Be A Turning Point For The Bitcoin Price
After four failed attempts to breach the $100,000 mark, Bitcoin has finally broken through the psychological threshold and is now open to uncharted price territory. Although the Bitcoin price retraced below $100,000 in the hours after, many investors remain optimistic, viewing this retracement as a temporary setback and believing that Bitcoin’s journey above $100,000 is far from over.
Related Reading
The optimism, however, is met with a contrasting perspective from an analysis of the TradingView platform, which offers a more cautious and bearish outlook. The analyst highlights the $100,000 level as a “magnet” that has consistently drawn price activity over the past few weeks, serving as a critical zone of attraction and resistance. With this in mind, the analyst’s outlook is of bearish price action, essentially predicting a retest of $94,000. From here, the analyst expects the occurrence of a market structure break (MSB), which in turn would trigger a broader correction for the BTC price.
Interestingly, the analyst predicted that breaking below the $94,000 price level would lead to a retest of $88,000. Should Bitcoin break below the $88,000 support, the analyst foresees further price declines that would drive the Bitcoin price toward an ideal target zone just above $72,200.
Bullish Sentiment Outweighs Bearish Sentiment
If the bearish scenario outlined by the analyst comes to pass, it could plunge the crypto market into another bear market, with other cryptocurrencies mirroring Bitcoin’s downward trajectory and erasing recent price gains.
Related Reading
However, this remains a prediction rather than an assessment of the current crypto market dynamics. Presently, the crypto market continues to bask in bullish sentiment, as evidenced by the Fear & Greed Index, which is currently at an extreme greed level of 81. A few analysts have suggested that Bitcoin’s price may still have room to climb, with some forecasting potential highs near $140,000.
At the time of writing, the Bitcoin price is trading at $98,350. Interestingly, the recent break above $100,000 led to a retest of $94,000 in the past 24 hours. However, the Bitcoin price rebounded from $94,000 instead of breaking below. Despite this rebound, the leading cryptocurrency might not be out of the woods yet.
Featured image created with Dall.E, chart from Tradingview.com

