Close Menu
    What's Hot

    Whales lose SYRUP sweet tooth despite Maple Finance’s growth

    Ethereum Prepares For A Parabolic Move – ETH/BTC Chart Signals Strong Bullish Setup

    Ethereum Enters Strategic Pause: Will Accumulation Below Resistance Spark A Surge?

    Facebook X (Twitter) Instagram
    yeek.io
    • Crypto Chart
    • Crypto Price Chart
    X (Twitter) Instagram TikTok
    Trending Topics:
    • Altcoin
    • Bitcoin
    • Blockchain
    • Crypto News
    • DeFi
    • Ethereum
    • Meme Coins
    • NFTs
    • Web 3
    yeek.io
    • Altcoin
    • Bitcoin
    • Blockchain
    • Crypto News
    • DeFi
    • Ethereum
    • Meme Coins
    • NFTs
    • Web 3
    Bitcoin

    Dogecoin Steadily Ascends To $0.4484 Resistance As Bulls Maintain Control

    Yeek.ioBy Yeek.ioDecember 8, 2024No Comments3 Mins Read
    Share Facebook Twitter Pinterest Copy Link Telegram LinkedIn Tumblr Email
    Share
    Facebook Twitter LinkedIn Pinterest Email

    Dogecoin has been steadily climbing, with its price approaching the critical $0.44848 mark. This consistent upward movement signals that the bulls are firmly in control, pushing DOGE closer to new territory. 

    As the price steadily advances, market attention intensifies, leaving many wondering if this persistent ascent is the beginning of a major breakout. With increased buying pressure and optimism surrounding Dogecoin, can the bulls maintain their momentum and push DOGE past this key resistance level? 

    Bullish Momentum Builds: Can Dogecoin Maintain Its Upward Trend?

    On the 4-hour chart, DOGE is trading above the 100-day Simple Moving Average (SMA), a strong indicator of its bullish momentum. This positioning underscores the token’s underlying strength and suggests that positive market sentiment is fueling its upward trend. The consistent rise points to increasing optimism as DOGE targets a breakout above the critical $0.44848 resistance level.

    DOGE firmly holding above the 100-day SMA | Source: DOGEUSDT on Tradingview.com

    An examination of the 4-hour Composite Trend Oscillator reveals that both the SMA and the indicator’s overall trend are heading toward the overbought zone, which suggests that buying pressure is intensifying and the asset is gaining strength. A persistent climb would indicate strong overbought conditions, reflecting robust demand and the possibility of more price growth.

    Also, the daily chart highlights Dogecoin’s strong upward movement, marked by the formation of a bullish candlestick as the price surges toward $0.44848, signaling the potential for additional gains. Its position above the SMA reinforces the positive trend, demonstrating sustained strength and bolstering market confidence, setting the stage for a continued rally.

    Dogecoin
    Dogecoin demonstrating robust ascent toward $0.44848 | Source: DOGEUSDT on Tradingview.com

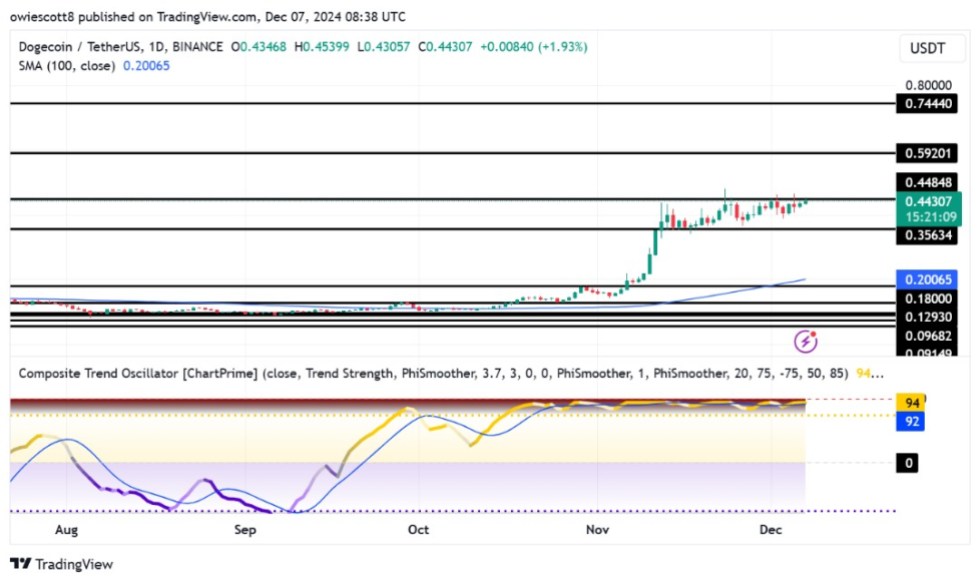
    Lastly, the daily chart’s Composite Trend Oscillator is currently reading in the overbought zone, indicating that the asset has experienced a significant surge in buying pressure. Despite this, the SMA and the trend line show no signs of reversing or dropping, suggesting that the bullish momentum remains intact.

    Key Levels To Watch For A Breakout

    The $0.44848 mark is a crucial resistance level, and a sustained move above it could open the door for further gains, possibly targeting the next resistance at $0.5920. If Dogecoin manages to breach this level, it could trigger a significant spike, with the price likely heading toward $0.7444 and other resistance zones.

    However, if Dogecoin faces rejection at this level, a pullback toward support areas such as $0.3563 may occur. A successful break below this support could lead to more price declines, with the next potential targets being lower support levels. Thus, traders must watch these key zones closely to assess whether the bulls can maintain control or if bearish pressure will take over.

    Dogecoin
    DOGE trading at $0.44 on the 1D chart | Source: DOGEUSDT on Tradingview.com

    Featured image from Adobe Stock, chart from Tradingview.com

    Follow on Google News Follow on Flipboard
    Share. Facebook Twitter Pinterest LinkedIn Tumblr Email Copy Link
    Previous ArticleMarket Expert Predicts $200K Surge Amid Retail FOMO And Volatility
    Next Article Avalanche: Here’s what can push AVAX to $65 soon
    Avatar
    Yeek.io
    • Website

    Yeek.io is your trusted source for the latest cryptocurrency news, market updates, and blockchain insights. Stay informed with real-time updates, expert analysis, and comprehensive guides to navigate the dynamic world of crypto.

    Related Posts

    Why Up-Only For 217 Days Is Possible

    March 15, 2025

    Russia Is Using Bitcoin And Crypto For Its Oil Trades With China And India

    March 15, 2025

    Sacks and his VC firm sold over $200M in crypto and stocks before WH role

    March 15, 2025
    Leave A Reply Cancel Reply

    Advertisement
    Demo
    Latest Posts

    Whales lose SYRUP sweet tooth despite Maple Finance’s growth

    Ethereum Prepares For A Parabolic Move – ETH/BTC Chart Signals Strong Bullish Setup

    Ethereum Enters Strategic Pause: Will Accumulation Below Resistance Spark A Surge?

    Solana indicators point north, bulls test $165 target

    Popular Posts
    Advertisement
    Demo
    X (Twitter) TikTok Instagram

    Categories

    • Altcoin
    • Bitcoin
    • Blockchain
    • Crypto News

    Categories

    • Defi
    • Ethereum
    • Meme Coins
    • Nfts

    Quick Links

    • Home
    • About
    • Contact
    • Privacy Policy

    Important Links

    • Crypto Chart
    • Crypto Price Chart
    © 2025 Yeek. All Copyright Reserved

    Type above and press Enter to search. Press Esc to cancel.